
Compare Titan Securities with Similar Stocks
Stock DNA
Non Banking Financial Company (NBFC)
INR 110 Cr (Micro Cap)
9.00
20
0.00%
0.00
11.71%
1.02
Total Returns (Price + Dividend) 
Titan Securities for the last several years.
Risk Adjusted Returns v/s
Returns Beta

News
Are Titan Securities Ltd latest results good or bad?
Titan Securities Ltd's latest financial results for the quarter ended March 2026 present a mixed operational picture. The company reported consolidated net sales of ₹2.81 crores, reflecting a significant quarter-on-quarter growth of 178.22% from ₹1.01 crores in the previous quarter. However, this revenue figure remains below the ₹3.35 crores achieved in December 2024, indicating challenges in establishing consistent revenue growth. The operating profit for the quarter reached ₹0.60 crores, marking the highest level recorded, with an operating profit margin of 21.35%. This margin, however, shows a notable decline from the previous quarter's 52.48%, highlighting the volatility in profitability that characterizes the securities trading sector. In terms of net profit, Titan Securities reported ₹2.79 crores, which represents a sequential decline of 23.98% from the previous quarter, yet a substantial year-on-ye...
Read full news article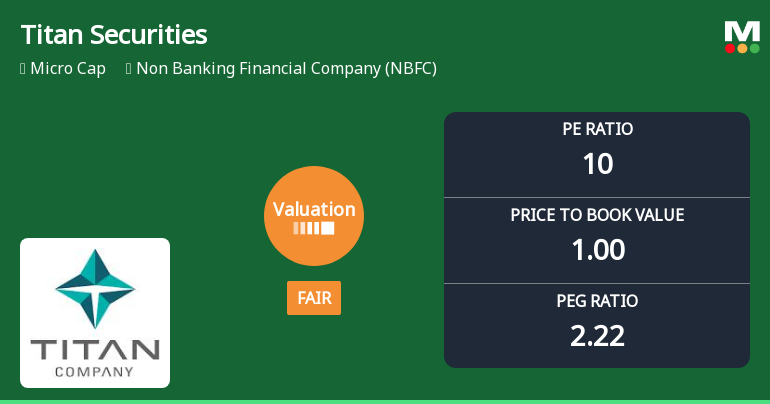
Titan Securities Ltd Valuation Shifts: From Attractive to Fair Amid Market Volatility
Titan Securities Ltd, a micro-cap player in the Non Banking Financial Company (NBFC) sector, has experienced a notable shift in its valuation parameters, moving from an attractive to a fair rating. This change reflects evolving market perceptions amid fluctuating financial metrics and sector dynamics, prompting investors to reassess the stock’s price attractiveness relative to its historical and peer benchmarks.
Read full news article
Titan Securities Q4 FY26: Strong Quarter Masks Underlying Volatility Concerns
Titan Securities Ltd., a Delhi-based non-banking financial company specialising in trading shares and securities, reported consolidated net profit of ₹2.79 crores for Q4 FY26 (January-March 2026), marking a robust 97.87% year-on-year surge but a concerning 23.98% sequential decline from the previous quarter. The micro-cap NBFC, with a market capitalisation of ₹109.00 crores, saw its shares trading at ₹43.49 on June 02, 2026, down 0.69% from the previous close and approximately 25% below its 52-week high of ₹58.35.
Read full news article Announcements
Announcement under Regulation 30 (LODR)-Newspaper Publication
01-Jun-2026 | Source : BSEAudited standalone and consolidated financial results for the quarter and financial year ended March 31 2026.
Standalone & Consolidated Audited Financial Results For The Quarter And Financial Year Ended March 31 2026.
30-May-2026 | Source : BSEStandalone & Consolidated Audited Financial Results for the quarter and financial year ended March 31 2026.
Announcement under Regulation 30 (LODR)-Resignation of Chief Financial Officer (CFO)
30-May-2026 | Source : BSEResignation of Mrs. Darshana Santoshi as Chief Financial Officer (KMP) w.e.f. May 30 2026
Corporate Actions

No Upcoming Board Meetings

No Dividend history available

No Splits history available

No Bonus history available

No Rights history available
Quality key factors
Valuation key factors
Technicals key factors
 Technical Indicator Scale: Bearish, Mildly Bearish, Sideways, Mildly Bullish, Bullish Turned
 Shareholding Snapshot : Mar 2026
Shareholding Compare (%holding)
Promoters
None
Held by 0 Schemes
Held by 0 FIIs
Manju Singla (13.76%)
Suresh Chand Garg (1.08%)
24.16%
Quarterly Results Snapshot (Consolidated) - Mar'26 - QoQ

QoQ Growth in quarter ended Mar 2026 is 178.22% vs -14.41% in Dec 2025

QoQ Growth in quarter ended Mar 2026 is -23.98% vs 14.33% in Dec 2025
Half Yearly Results Snapshot (Consolidated) - Sep'25
Growth in half year ended Sep 2025 is -51.47% vs 105.12% in Sep 2024
Growth in half year ended Sep 2025 is -8.13% vs 14.79% in Sep 2024
Nine Monthly Results Snapshot (Consolidated) - Dec'25
YoY Growth in nine months ended Dec 2025 is -59.41% vs 56.14% in Dec 2024
YoY Growth in nine months ended Dec 2025 is 6.62% vs 6.21% in Dec 2024
Annual Results Snapshot (Consolidated) - Mar'26
YoY Growth in year ended Mar 2026 is -42.80% vs 48.86% in Mar 2025
YoY Growth in year ended Mar 2026 is 19.01% vs 3.97% in Mar 2025
About Titan Securities Ltd

Company Coordinates


