
Compare Tokai Carbon Co., Ltd. with Similar Stocks
Stock DNA
Electronics & Appliances
JPY 234,178 Million (Small Cap)
13.00
NA
0.10%
0.43
7.45%
0.85
Revenue and Profits:
Net Sales:
77,730 Million
(Quarterly Results - Jun 2025)
Net Profit:
6,190 Million
Total Returns (Price + Dividend) 
TimePeriod
Price Return
Dividend Return
Total Return
3 Months
7.47%
0%
7.47%
6 Months
13.45%
0%
13.45%
1 Year
9.46%
0%
9.46%
2 Years
-14.26%
0%
-14.26%
3 Years
-13.48%
0%
-13.48%
4 Years
-35.55%
0%
-35.55%
5 Years
-0.85%
0%
-0.85%
Tokai Carbon Co., Ltd. for the last several years.
Risk Adjusted Returns v/s
News
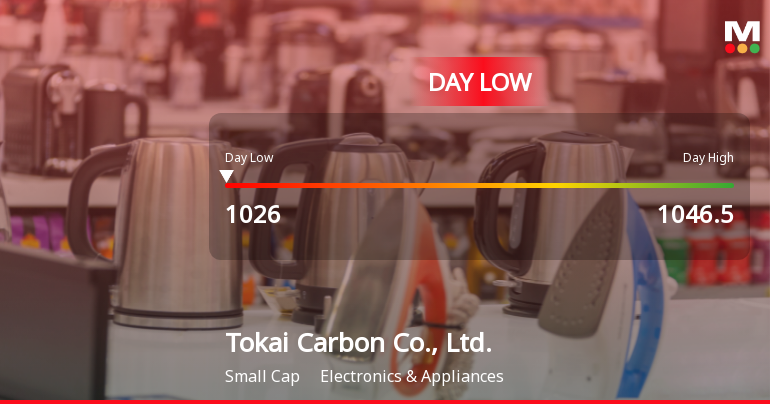
Tokai Carbon Shares Hit Day Low Amid Price Pressure, Dropping to JPY 1,026.00
Tokai Carbon Co., Ltd. faced a notable decline in stock performance, dropping 7.11% today. The company has experienced a 4.6% decrease over the past week and a 2.43% decline in the last month. Despite a year-to-date gain, its long-term outlook is concerning due to declining operating profits.
Read full news article Announcements

No announcement available
Corporate Actions
No corporate action available
Quality key factors
Factor
Value
Sales Growth (5y)
7.20%
EBIT Growth (5y)
-10.39%
EBIT to Interest (avg)
20.41
Debt to EBITDA (avg)
1.84
Net Debt to Equity (avg)
0.42
Sales to Capital Employed (avg)
0.72
Tax Ratio
12.12%
Dividend Payout Ratio
0
Pledged Shares
0
Institutional Holding
0
ROCE (avg)
6.86%
ROE (avg)
7.05%
Valuation key factors
Factor
Value
P/E Ratio
13
Industry P/E
Price to Book Value
0.84
EV to EBIT
14.93
EV to EBITDA
5.55
EV to Capital Employed
0.89
EV to Sales
0.99
PEG Ratio
NA
Dividend Yield
0.10%
ROCE (Latest)
5.94%
ROE (Latest)
6.60%
Technicals key factors
Indicator
Weekly
Monthly
MACD
Bullish
Mildly Bullish
RSI
No Signal
No Signal
Bollinger Bands
Mildly Bullish
Bullish
Moving Averages
Bullish (Daily)
KST
Bearish
Bullish
Dow Theory
No Trend
Mildly Bearish
OBV
No Trend
Mildly Bullish
 Technical Indicator Scale: Bearish, Mildly Bearish, Sideways, Mildly Bullish, Bullish Turned
 Shareholding Snapshot
No data for shareholding present.
Shareholding Compare (%holding)
No data for shareholding present.
Quarterly Results Snapshot (Consolidated) - Jun'25 - YoY
Jun'25
Jun'24
Change(%)
Net Sales
77,730.00
88,761.00
-12.43%
Operating Profit (PBDIT) excl Other Income
14,230.00
16,031.00
-11.23%
Interest
606.00
388.00
56.19%
Exceptional Items
1,017.00
0.00
Consolidate Net Profit
6,190.00
3,047.00
103.15%
Operating Profit Margin (Excl OI)
87.70%
55.60%
3.21%
USD in Million.

Net Sales
YoY Growth in quarter ended Jun 2025 is -12.43% vs -3.41% in Jun 2024

Consolidated Net Profit
YoY Growth in quarter ended Jun 2025 is 103.15% vs -65.13% in Jun 2024
Annual Results Snapshot (Consolidated) - Dec'24
Dec'24
Dec'23
Change(%)
Net Sales
350,114.00
363,946.00
-3.80%
Operating Profit (PBDIT) excl Other Income
61,121.00
75,950.00
-19.52%
Interest
1,965.00
1,565.00
25.56%
Exceptional Items
-69,601.00
0.00
Consolidate Net Profit
-52,949.00
28,754.00
-284.14%
Operating Profit Margin (Excl OI)
55.40%
106.40%
-5.10%
USD in Million.
Net Sales
YoY Growth in year ended Dec 2024 is -3.80% vs 6.93% in Dec 2023
Consolidated Net Profit
YoY Growth in year ended Dec 2024 is -284.14% vs 5.21% in Dec 2023
About Tokai Carbon Co., Ltd.

Tokai Carbon Co., Ltd.
Electronics & Appliances
No Details Available.
Company Coordinates
No Company Details Available
InfinHub Market Technologies FZ-LLC, Building-2, Unit 112, Dubai Internet City, Dubai, United Arab Emirates
GET THE MARKETSMOJO APP


Company
Stocks
Portfolio


"Investment in securities markets are subject to market risk. Read all the related documents carefully before investing."