
Compare Trejhara Solutio with Similar Stocks
Dashboard
Weak Long Term Fundamental Strength with a -21.79% CAGR growth in Operating Profits over the last 5 years
- Company's ability to service its debt is weak with a poor EBIT to Interest (avg) ratio of -2.88
- The company has been able to generate a Return on Equity (avg) of 1.89% signifying low profitability per unit of shareholders funds
Underperformed the market in the last 1 year
Stock DNA
Computers - Software & Consulting
INR 335 Cr (Micro Cap)
37.00
33
0.00%
0.01
2.97%
1.12
Total Returns (Price + Dividend) 
Latest dividend: 0.5 per share ex-dividend date: Sep-16-2022
Risk Adjusted Returns v/s
Returns Beta

News
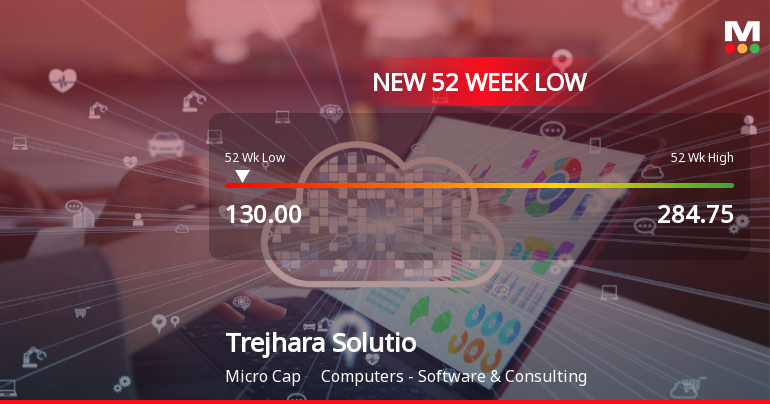
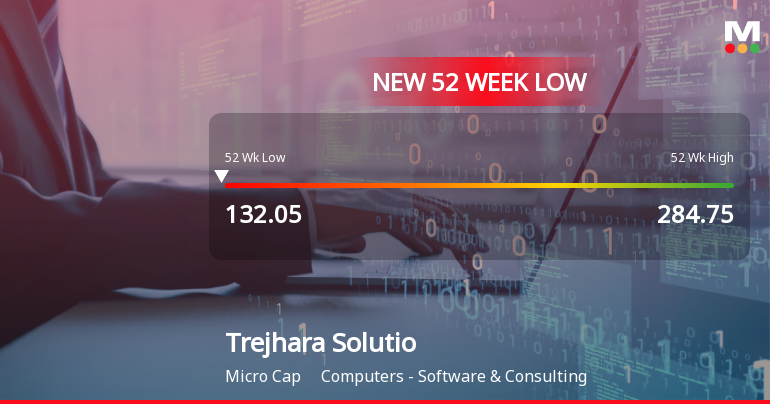
Five Consecutive Losses Push Trejhara Solutions Ltd to a New 52-Week Low
For the fifth consecutive session, Trejhara Solutions Ltd has closed lower, slipping to within 0.71% of its 52-week low at Rs 132.05 on 8 Jul 2026. This persistent decline has dragged the stock down by 6.4% over the last three days, underperforming its sector and the broader market significantly.
Read full news article
Trejhara Solutions Ltd Downgraded to Strong Sell Amid Technical and Financial Concerns
Trejhara Solutions Ltd, a micro-cap player in the Computers - Software & Consulting sector, has seen its investment rating downgraded from Sell to Strong Sell as of 7 July 2026. This shift reflects deteriorating technical indicators, a reassessment of valuation metrics, and ongoing concerns about the company’s financial trends and quality of fundamentals, despite some recent positive quarterly results.
Read full news article Announcements
Compliances-Certificate under Reg. 74 (5) of SEBI (DP) Regulations 2018
13-Jul-2026 | Source : BSEPlease find enclosed Certificate under Reg. 74(5) of SEBI (DP) Regulation 2018 for the quarter ended June 30 2026.
Board Meeting Intimation for Considering And Approving The Un-Audited (Standalone & Consolidated) Financial Results Of The Company For The Quarter Ended On June 30 2026.
07-Jul-2026 | Source : BSETrejhara Solutions Ltdhas informed BSE that the meeting of the Board of Directors of the Company is scheduled on 04/08/2026 inter alia to consider and approve the Un-Audited (Standalone & Consolidated) Financial Results of the Company for the quarter ended on June 30 2026.
Closure of Trading Window
29-Jun-2026 | Source : BSEIntimation regarding closure of trading window for the quarter ended June 2026
Corporate Actions

04 Aug 2026

Trejhara Solutions Ltd has declared 5% dividend, ex-date: 16 Sep 22

No Splits history available

No Bonus history available

No Rights history available
Quality key factors
Valuation key factors
Technicals key factors
 Technical Indicator Scale: Bearish, Mildly Bearish, Sideways, Mildly Bullish, Bullish Turned
 Shareholding Snapshot : Jun 2026
Shareholding Compare (%holding)
Non Institution
None
Held by 0 Schemes
Held by 2 FIIs (0.01%)
Marvis Investments Ltd (11.0%)
Ajay Dilkush Sarupria (9.15%)
43.16%
Quarterly Results Snapshot (Consolidated) - Mar'26 - QoQ

QoQ Growth in quarter ended Mar 2026 is 23.84% vs -0.35% in Dec 2025
QoQ Growth in quarter ended Mar 2026 is 154.55% vs -66.11% in Dec 2025
Half Yearly Results Snapshot (Consolidated) - Sep'25

Growth in half year ended Sep 2025 is 43.50% vs 361.13% in Sep 2024
Growth in half year ended Sep 2025 is 73.06% vs -68.59% in Sep 2024
Nine Monthly Results Snapshot (Consolidated) - Dec'25
YoY Growth in nine months ended Dec 2025 is 90.08% vs 221.62% in Dec 2024
YoY Growth in nine months ended Dec 2025 is 75.24% vs -66.81% in Dec 2024
Annual Results Snapshot (Consolidated) - Mar'26
YoY Growth in year ended Mar 2026 is 22.89% vs 406.56% in Mar 2025
YoY Growth in year ended Mar 2026 is 101.18% vs -78.50% in Mar 2025
About Trejhara Solutions Ltd

Company Coordinates


