
Compare Trishakti Indus with Similar Stocks
Dashboard
Strong Long Term Fundamental Strength with an average Return on Equity (ROE) of 15.14%
Healthy long term growth as Operating profit has grown by an annual rate of 139.75%
With a growth in Operating Profit of 40.76%, the company declared Very Positive results in Mar 26
Majority shareholders : Promoters
Consistent Returns over the last 3 years
Stock DNA
Non Banking Financial Company (NBFC)
INR 355 Cr (Micro Cap)
46.00
21
0.00%
1.91
16.71%
7.94
Total Returns (Price + Dividend) 
Latest dividend: 0.14 per share ex-dividend date: Sep-17-2024
Risk Adjusted Returns v/s
Returns Beta

News
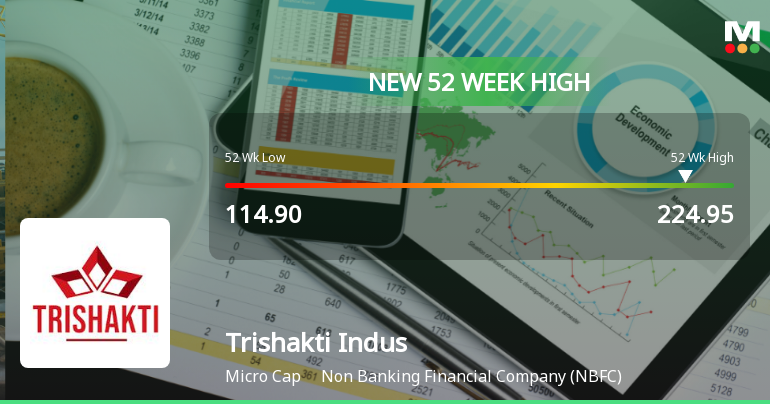
Broad-Based Technical Strength Lifts Trishakti Industries Ltd to 52-Week High of Rs 224.95
With a sustained six-day rally delivering a 27.6% gain, Trishakti Industries Ltd surged to a fresh 52-week and all-time high of Rs 224.95 on 16 Jul 2026, outpacing its sector and the broader market. This milestone caps a year of strong price momentum, with the stock rising from a 52-week low of Rs 114.90, reflecting robust technical signals across multiple timeframes.
Read full news articleWhen is the next results date for Trishakti Industries Ltd?
The next results date for Trishakti Industries Ltd is scheduled for July 22, 2026....
Read full news article
Broad-Based Technical Strength Lifts Trishakti Industries Ltd to 52-Week High of Rs 197.25
With a decisive breakthrough to Rs 197.25 on 15 Jul 2026, Trishakti Industries Ltd has reached a fresh 52-week high, propelled by a confluence of bullish technical indicators and sustained price momentum over the past week.
Read full news article Announcements
Announcement under Regulation 30 (LODR)-Analyst / Investor Meet - Intimation
16-Jul-2026 | Source : BSEPlease find enclosed details of Earning Conference Call scheduled to be held on Thursday July 23 2026 at 4:00 PM IST.
Announcement under Regulation 30 (LODR)-Analyst / Investor Meet - Intimation
15-Jul-2026 | Source : BSEPlease find enclosed details of Earning Conference Call scheduled to be held on Thursday July 23 2026 at 4:00 PM IST.
Board Meeting Intimation for Board Meeting Intimation To Consider And Approve Unaudited Financial Results (Standalone And Consolidate) Of The Company For The Quarter Ended June 30 2026
14-Jul-2026 | Source : BSETrishakti Industries Ltdhas informed BSE that the meeting of the Board of Directors of the Company is scheduled on 22/07/2026 inter alia to consider and approve Unaudited Financial Results (Standalone and Consolidated) of the Company for the quarter ended June 30 2026.
Corporate Actions

22 Jul 2026

Trishakti Industries Ltd has declared 7% dividend, ex-date: 17 Sep 24

Trishakti Industries Ltd has announced 2:10 stock split, ex-date: 16 Jan 24

No Bonus history available

No Rights history available
Quality key factors
Valuation key factors
Technicals key factors
 Technical Indicator Scale: Bearish, Mildly Bearish, Sideways, Mildly Bullish, Bullish Turned
 Shareholding Snapshot : Mar 2026
Shareholding Compare (%holding)
Promoters
None
Held by 0 Schemes
Held by 0 FIIs
Suresh Jhanwar (24.81%)
Kred Hospitality Llp (1.27%)
20.65%
Quarterly Results Snapshot (Consolidated) - Mar'26 - QoQ

QoQ Growth in quarter ended Mar 2026 is 13.87% vs 20.30% in Dec 2025
QoQ Growth in quarter ended Mar 2026 is 6.64% vs 51.57% in Dec 2025
Half Yearly Results Snapshot (Consolidated) - Sep'25

Growth in half year ended Sep 2025 is -24.75% vs -69.30% in Sep 2024
Growth in half year ended Sep 2025 is 10.71% vs 873.91% in Sep 2024
Nine Monthly Results Snapshot (Consolidated) - Dec'25
YoY Growth in nine months ended Dec 2025 is 18.32% vs -79.91% in Dec 2024
YoY Growth in nine months ended Dec 2025 is 116.37% vs 370.83% in Dec 2024
Annual Results Snapshot (Consolidated) - Mar'26
YoY Growth in year ended Mar 2026 is 63.63% vs -87.36% in Mar 2025
YoY Growth in year ended Mar 2026 is 109.83% vs 415.94% in Mar 2025
About Trishakti Industries Ltd

Company Coordinates


