TVS Motor Co.

  • Market Cap: Large Cap
  • Industry: Automobiles
  • ISIN: INE494B01023
  • NSEID: TVSMOTOR
  • BSEID: 532343
INR
4,203.00
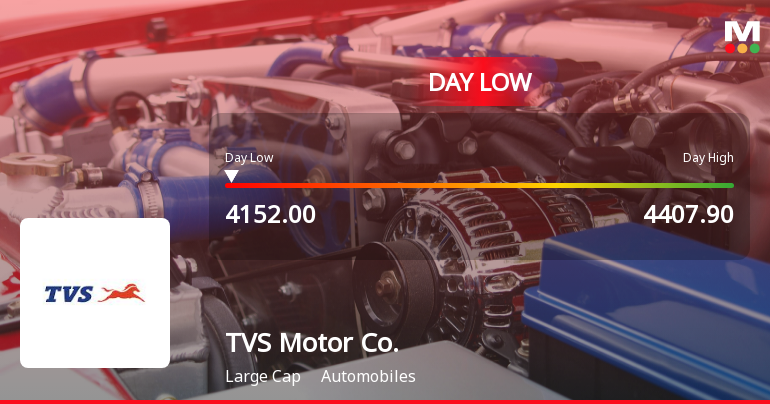
-127 (-2.93%)
BSENSE

Sep 01, 03:30 PM

BSE+NSE Vol: 19.72 lacs

  • Price Points
  • Score
  • Mojo Parameters
  • Total Return
  • News and Corporate Actions
  • Key factors
  • Shareholding
  • Financials
  • CompanyCV
stock-summaryPrice Point
High/Low

1Day

52 Week

Valuation
Technical
Day's Volume

CASH

19.72 lacs (26.61%) Volume

Shareholding (Jun 2026)

FII

20.45%

Held by 897 FIIs

DII

21.13%

Held by 62 DIIs

Promoter

50.27%

Why is TVS Motor Company Ltd falling/rising?

02-Sep-2026

As of 01-Sep, TVS Motor Company's stock price is Rs 4,203.00, down 2.93% today and 4.50% over the past week, indicating a short-term downturn despite a strong year-to-date performance. The stock is currently below its moving averages, reflecting negative market sentiment, although the company has a solid long-term outlook.

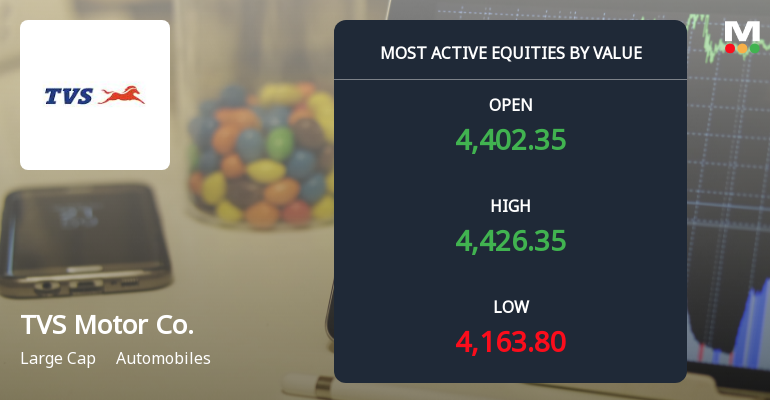
As of 01-Sep, TVS Motor Company Ltd's stock price is falling, currently at Rs 4,203.00, reflecting a decrease of Rs 127.00 or 2.93%. This decline is evident in today's performance, where the stock underperformed its sector by 3.09% and reached an intraday low of Rs 4,123.55, marking a drop of 4.77%. <BR><BR>Over the past week, the stock has decreased by 4.50%, while the benchmark Sensex has only fallen by 0.92%. In the last month, TVS Motor's stock has also seen a decline of 2.49%, compared to a 1.47% drop in the Sensex. Despite a strong year-to-date performance with a 13.00% increase, the recent trends indicate a short-term downturn.<BR><BR>The stock's moving averages show that it is currently lower than the 5-day and 20-day moving averages, which could indicate a bearish trend in the short term. Additionally, while there has been a rise in investor participation, with delivery volume increasing by 88.81% against the 5-day average, the overall market sentiment appears to be negative, contributing to the stock's decline.<BR><BR>Despite these short-term challenges, the company maintains a strong long-term outlook, with consistent positive results over the last 11 quarters and a high return on capital employed (ROCE) of 16.32%. However, the immediate market reaction seems to be influenced by recent performance metrics and broader market conditions, leading to the current fall in stock price.

View full answer

Who are in the management team of TVS Motor Co.?

01-Sep-2026

The management team of TVS Motor Co. includes Venu Srinivasan and Sudarshan Venu as Managing Directors, K N Radhakrishnan as CEO, and several independent directors, with Sir Ralf Dieter Speth serving as Chairman. This team combines diverse expertise to lead the company.

The management team of TVS Motor Co. includes the following key members:<BR><BR>1. **Venu Srinivasan** - Managing Director<BR>2. **Sudarshan Venu** - Managing Director<BR>3. **K N Radhakrishnan** - Director & Chief Executive Officer<BR>4. **C R Dua** - Independent Director<BR>5. **Hemant Krishan Singh** - Independent Director<BR>6. **Lalita D Gupte** - Independent Director<BR>7. **R Gopalan** - Independent Director<BR>8. **Kuock Meng Xiong** - Independent Director<BR>9. **B Sriram** - Independent Director<BR>10. **K S Srinivasan** - Company Secretary & Compliance Officer<BR>11. **Lakshmi Venu** - Director<BR>12. **Sir Ralf Dieter Speth** - Chairman (Non-Executive)<BR><BR>This team brings a diverse range of expertise and leadership to the company.

View full answer

What does TVS Motor Co. do?

01-Sep-2026

TVS Motor Company Ltd is India's third largest two-wheeler manufacturer, known for its automotive products. As of June 2026, it reported net sales of ₹16,296 Cr and a net profit of ₹1,019 Cr, with a market cap of ₹203,575 Cr.

Overview:<BR>TVS Motor Company Ltd is a leading manufacturer in the automobiles industry, specifically recognized as the third largest two-wheeler manufacturer in India, and operates within the large-cap market segment.<BR><BR>History:<BR>TVS Motor Company was initially incorporated as 'Sundaram Auto Engineers (India) Limited' in 1992. The company underwent several name changes, becoming TVS Suzuki Limited in 2000 and finally rebranding to TVS Motor Company in 2001. The latest quarterly results reported net sales and net profit for June 2026.<BR><BR>Financial Snapshot:<BR>- Net Sales: 16,296 Cr (Quarterly Results - Jun 2026)<BR>- Net Profit: 1,019 Cr (Quarterly Results - Jun 2026)<BR>- Market Cap: INR 203,575 Cr (Large Cap)<BR><BR>Key Metrics:<BR>- P/E: 59.00<BR>- Industry P/E: 33<BR>- Dividend Yield: 0.28%<BR>- Debt Equity: 2.90<BR>- Return on Equity: 31.91%<BR>- Price to Book: 21.36<BR><BR>Contact Details:<BR>Address: Chaitanya No 12 Nungambakkam, Khader Nawaz Khan Road Chennai Tamil Nadu : 600034<BR>Tel: 91-044-28332115<BR>Email: contactus@tvsmotor.com<BR>Website: http://www.tvsmotor.com

View full answer

Who are the peers of the TVS Motor Co.?

01-Sep-2026

TVS Motor Co.'s peers include Maruti Suzuki, M & M, Bajaj Auto, Eicher Motors, Hyundai Motor I, Tata Motors PVeh, Hero MotoCorp, Ashok Leyland, and Ather Energy. In terms of performance, TVS Motor Co. has a 1-year return of 32.10%, with below-average growth and capital structure compared to its peers.

Peers: The peers of TVS Motor Co. are Maruti Suzuki, M & M, Bajaj Auto, Eicher Motors, Hyundai Motor I, Tata Motors PVeh, Hero MotoCorp, Ashok Leyland, and Ather Energy.<BR><BR>Quality Snapshot: Excellent management risk is observed at Bajaj Auto, Hyundai Motor I, and Hero MotoCorp, while Good management risk is found at Maruti Suzuki, M & M, Eicher Motors, TVS Motor Co., Ashok Leyland, and Tata Motors PVeh, and the rest. For Growth, Excellent growth is noted at Maruti Suzuki, M & M, Bajaj Auto, Eicher Motors, and the rest, while Average growth is seen at Hero MotoCorp and Ather Energy, and Below Average growth is present at Tata Motors PVeh and TVS Motor Co. In terms of Capital Structure, Excellent capital structure is attributed to Maruti Suzuki, Bajaj Auto, Eicher Motors, and Hyundai Motor I, while Below Average capital structure is noted at TVS Motor Co., Ashok Leyland, and Ather Energy, and Average capital structure is found at Tata Motors PVeh.<BR><BR>Return Snapshot: The peer with the highest 1-year return is Ather Energy at 273.18%, while the lowest is Maruti Suzuki at -8.86%. TVS Motor Co. has a 1-year return of 32.10%, which is significantly higher than Maruti Suzuki's but lower than Ather Energy's. Additionally, Ashok Leyland and Tata Motors PVeh have negative six-month returns.

View full answer

How big is TVS Motor Co.?

01-Sep-2026

As of 31st August, TVS Motor Company Ltd has a market capitalization of 203,575.00 Cr, with recent net sales of 60,154.99 Cr and a net profit of 3,427.72 Cr. Shareholder's funds are 9,564.25 Cr, and total assets amount to 55,926.16 Cr as of March 2026.

As of 31st August, TVS Motor Company Ltd has a market capitalization of 203,575.00 Cr, categorizing it as a Large Cap company.<BR><BR>In the latest four quarters, the company reported Net Sales of 60,154.99 Cr and a Net Profit of 3,427.72 Cr.<BR><BR>The latest reporting period for the balance sheet is March 2026, with Shareholder's Funds amounting to 9,564.25 Cr and Total Assets totaling 55,926.16 Cr.

View full answer

Should I buy, sell or hold TVS Motor Company Ltd?

01-Sep-2026

Are TVS Motor Company Ltd latest results good or bad?

22-Jul-2026

TVS Motor Company's Q1 FY27 results are strong, with a 67.11% increase in net profit and a 33.46% rise in net sales. However, concerns about declining margins and high stock valuation suggest investors should proceed with caution.

TVS Motor Company Ltd's latest results for Q1 FY27 are quite strong, showcasing impressive growth in both net profit and sales. The consolidated net profit surged by 67.11% year-on-year to ₹1,019.43 crores, while net sales increased by 33.46% year-on-year to ₹16,295.52 crores. This performance reflects the company's successful strategy of premiumisation and market share expansion in both domestic and international markets.<BR><BR>Despite these positive results, there are some concerns regarding margin pressures, as the operating margin slightly declined to 14.47% from the previous year. Additionally, the stock trades at a high valuation, with a P/E ratio of 59.02, which may limit upside potential for investors.<BR><BR>Overall, while the quarterly performance is commendable, investors should be mindful of the high valuation and potential risks associated with the company's leverage and margin pressures. The outlook remains cautiously optimistic, with strong operational fundamentals but a need for careful consideration regarding valuation levels.

View full answer

When is the next results date for TVS Motor Company Ltd?

06-May-2026

The next results date for TVS Motor Company Ltd is 13 May 2026.

The next results date for TVS Motor Company Ltd is scheduled for 13 May 2026.

View full answer

Is TVS Motor Co. overvalued or undervalued?

02-Dec-2025

As of December 1, 2025, TVS Motor Co. is considered overvalued with a PE Ratio of 66.69 and an EV to EBITDA of 24.70, indicating a shift from fair to expensive valuation compared to peers like Bajaj Auto and Hero MotoCorp.

As of 1 December 2025, the valuation grade for TVS Motor Co. has moved from fair to expensive, indicating a shift in perception regarding its market value. The company is currently considered overvalued based on several key financial ratios, including a PE Ratio of 66.69, an EV to EBITDA of 24.70, and a Price to Book Value of 21.44. These figures suggest that the stock is trading at a premium compared to its earnings and asset value.<BR><BR>In comparison to its peers, TVS Motor Co. stands out with a significantly higher PE Ratio than Bajaj Auto, which has a PE of 30.48, and Eicher Motors, which is rated very expensive at 38.27. Additionally, the PEG Ratio of 1.71 indicates that the stock may not be justified by its growth prospects when compared to Hero MotoCorp, which has a more attractive PEG of 0.86. Despite the company's strong performance, reflected in its recent stock returns outperforming the Sensex over various periods, the current valuation suggests that investors may be paying too much for future growth potential.

View full answer

Is TVS Motor Co. technically bullish or bearish?

02-Dec-2025

As of December 1, 2025, TVS Motor Co. shows a mildly bullish trend with daily moving averages indicating positive momentum, but mixed signals from weekly MACD and KST suggest a cautious approach.

As of 1 December 2025, the technical trend for TVS Motor Co. has changed from bullish to mildly bullish. The current stance is mildly bullish, driven primarily by the daily moving averages indicating bullish momentum. However, the weekly MACD and KST are mildly bearish, suggesting some caution in the short term. The Bollinger Bands are bullish on both weekly and monthly time frames, supporting the overall positive outlook. The Dow Theory shows a mildly bullish signal on the weekly chart but is mildly bearish on the monthly chart, indicating mixed signals across different time frames. Overall, while there are bullish indicators, the presence of mildly bearish signals suggests a cautious approach.

View full answer

How has been the historical performance of TVS Motor Co.?

06-Nov-2025

TVS Motor Co. has demonstrated consistent financial growth, with net sales increasing from 19,420.82 Cr in Mar'21 to 44,089.01 Cr in Mar'25, and profit after tax rising from 615.25 Cr to 2,424.02 Cr, reflecting improved profitability and operational efficiency. Total assets and liabilities also grew significantly, while cash flow from operating activities turned positive, indicating strong cash generation capabilities.

Answer:<BR>The historical performance of TVS Motor Co. shows a consistent growth trajectory in net sales, with figures rising from 19,420.82 Cr in Mar'21 to 44,089.01 Cr in Mar'25. This upward trend is mirrored in total operating income, which increased from 18,849.31 Cr in Mar'20 to 44,089.01 Cr in Mar'25. The company's operating profit (PBDIT) also demonstrated significant growth, climbing from 2,285.05 Cr in Mar'21 to 6,718.28 Cr in Mar'25, resulting in an operating profit margin that improved from 11.52% to 15.08% over the same period. Profit before tax rose from 829.38 Cr in Mar'21 to 3,579.47 Cr in Mar'25, while profit after tax increased from 615.25 Cr to 2,424.02 Cr, reflecting a PAT margin growth from 3.13% to 5.33%. The company's total assets expanded from 19,272.17 Cr in Mar'20 to 47,441.00 Cr in Mar'25, alongside total liabilities which grew from 19,272.17 Cr to 47,441.00 Cr as well. Cash flow from operating activities improved significantly, turning from a negative 1,252.00 Cr in Mar'24 to a positive 3,502.00 Cr in Mar'25, contributing to a net cash inflow of 1,759.00 Cr in Mar'25.<BR><BR>Breakdown:<BR>TVS Motor Co. has shown remarkable growth in its financial performance over the years. Starting with net sales, the company has seen a steady increase from 19,420.82 Cr in Mar'21 to 44,089.01 Cr in Mar'25, indicating strong market demand and operational efficiency. Total operating income followed a similar upward trajectory, reaching 44,089.01 Cr in Mar'25. The operating profit (PBDIT) also rose significantly, reflecting improved cost management and profitability, with the operating profit margin increasing to 15.08%. Profit before tax and profit after tax both surged, showcasing the company's ability to convert sales into substantial earnings, with PAT margin reaching 5.33%. On the balance sheet, total assets and liabilities have both escalated, indicating growth in both resources and obligations, while cash flow from operating activities turned positive, highlighting improved cash generation capabilities. Overall, TVS Motor Co.'s financial metrics reflect a robust growth pattern and operational success over the analyzed period.

View full answer

Who are the top shareholders of the TVS Motor Co.?

17-Jul-2025

The top shareholders of TVS Motor Co. include Tvs Holdings Limited with 50.26%, foreign institutional investors at 21.48%, and mutual funds holding 15.16%. ICICI Prudential Mutual Fund is the largest public shareholder with a 7.35% stake, while individual investors own 6.9%.

The top shareholders of TVS Motor Co. include a mix of promoters, institutional investors, and individual shareholders. The largest shareholder is Tvs Holdings Limited, which holds 50.26% of the company. In addition, foreign institutional investors (FIIs) own 21.48%, while mutual funds collectively hold 15.16% across 39 schemes. The highest public shareholder is ICICI Prudential Mutual Fund, with a stake of 7.35%. Individual investors account for 6.9% of the total shareholding.

View full answer

What is the bonus history of the TVS Motor Co.?

06-Jun-2025

TVS Motor Co. announced a 1:1 bonus issue on September 8, 2010, with a record date of September 9, 2010, allowing shareholders to receive one additional share for each share held.

TVS Motor Co. has a bonus history that includes a notable 1:1 bonus issue announced on September 8, 2010. The record date for this bonus was September 9, 2010. This means that shareholders received one additional share for every share they held as of the record date.

View full answer

Has TVS Motor Co. declared dividend?

06-Jun-2025

Yes, TVS Motor Company Ltd has declared a 1000% dividend, amounting to ₹10 per share, with an ex-date of March 26, 2025. The company has shown strong total returns over various periods, particularly in the long term.

TVS Motor Company Ltd has declared a 1000% dividend.<BR><BR>Dividend Details:<BR>- Percentage announced: 1000%<BR>- Amount per share: 10<BR>- Ex-date: 26 Mar 2025<BR><BR>Dividend Yield: 0.37%.<BR><BR>Total Returns by Period:<BR>In the 6-month period, the price return was 8.72%, the dividend return was 0.40%, resulting in a total return of 9.12%.<BR><BR>For the 1-year period, the price return was 14.49%, the dividend return was 0.41%, leading to a total return of 14.9%.<BR><BR>Over 2 years, the price return reached 106.23%, with a dividend return of 1.35%, culminating in a total return of 107.58%.<BR><BR>In the 3-year period, the price return was 276.85%, the dividend return was 3.09%, resulting in a total return of 279.94%.<BR><BR>For the 4-year period, the price return was 340.21%, with a dividend return of 4.30%, leading to a total return of 344.51%.<BR><BR>In the 5-year period, the price return was 663.88%, the dividend return was 7.85%, resulting in a total return of 671.73%.<BR><BR>Overall, TVS Motor Company Ltd has declared a significant dividend, and the total returns over various periods indicate strong performance, particularly in the longer term, showcasing both price appreciation and dividend contributions.

View full answer
iScoreScore
Click here to find our call on this stock
Strong Sell
Sell
Hold
Buy
Strong Buy

Dashboard

1

High Management Efficiency with a high ROCE of 16.32%

 
2

High Debt Company with a Debt to Equity ratio (avg) of 2.88 times

3

Healthy long term growth as Net Sales has grown by an annual rate of 22.10% and Operating profit at 31.27%

 
4

The company has declared Positive results for the last 11 consecutive quarters

5

With ROCE of 19.1, it has a Expensive valuation with a 6.1 Enterprise value to Capital Employed

6

High Institutional Holdings at 41.59%

7

Consistent Returns over the last 3 years

stock-summaryMojo Parameters

Mojo Parameters

Loading Valuation Snapshot...

Stock DNA

stock-summary
Industry

Automobiles

stock-summary
Market cap

INR 207,181 Cr (Large Cap)

stock-summary
P/E

58.00

stock-summary
Industry P/E

33

stock-summary
Dividend Yield

0.28%

stock-summary
Debt Equity

2.90

stock-summary
Return on Equity

31.91%

stock-summary
Price to Book

21.51

Revenue and Profits:
Net Sales:
16,296 Cr
(Quarterly Results - Jun 2026)
Net Profit:
1,019 Cr
stock-summaryTotal Returns
Total Returns (Price + Dividend) stock-summary
Dividend Yield (0.28%)
TimePeriod
Price Return
Dividend Return
Total Return
3 Months
25.72%
0%
25.72%
6 Months
8.61%
0.32%
8.93%
1 Year
25.24%
0.33%
25.57%
2 Years
49.46%
0.78%
50.24%
3 Years
188.95%
1.97%
190.92%
4 Years
314.07%
3.37%
317.44%
5 Years
693.24%
6.97%
700.21%

Latest dividend: 12.000000000000002 per share ex-dividend date: Mar-30-2026

Risk Adjusted Returns v/s stock-summary
Returns Beta
Icon
Beta has not been calculated since enough price history is not available
stock-summaryNews & Corporate Actions

News

Announcements stock-summary

Announcement under Regulation 30 (LODR)-Change in Directorate

28-Aug-2026 | Source : BSE

Mr K N Radhakrishnan (DIN : 02599393) will continue as a Director & CEO until 27th January 2027 and subsequently will serve as a Non - Executive Director upto the date of the ensuing AGM scheduled in July 2027

Announcement under Regulation 30 (LODR)-Press Release / Media Release

28-Aug-2026 | Source : BSE

TVS Motor Company appoints Peyman Kargar as Director and Chief Executive Officer

Announcement under Regulation 30 (LODR)-Change in Management

28-Aug-2026 | Source : BSE

Appointment of Mr Peyman Kargar (DIN: 07906077) as Director & Chief Executive Officer w.e.f 27th January 2027

Corporate Actions stock-summary

stock-summary
BOARD MEETING

No Upcoming Board Meetings

stock-summary
DIVIDEND

TVS Motor Company Ltd has declared 1200% dividend, ex-date: 30 Mar 26

stock-summary
SPLITS

No Splits history available

stock-summary
BONUS

TVS Motor Company Ltd has announced 4:1 bonus issue, ex-date: 25 Aug 25

stock-summary
RIGHTS

No Rights history available

stock-summaryKey Factors

Quality key factors stock-summary

Factor
Value
Sales Growth (5y)
22.10%
EBIT Growth (5y)
31.27%
EBIT to Interest (avg)
2.65
Debt to EBITDA (avg)
4.02
Net Debt to Equity (avg)
2.90
Sales to Capital Employed (avg)
1.44
Tax Ratio
33.18%
Dividend Payout Ratio
18.89%
Pledged Shares
0
Institutional Holding
41.59%
ROCE (avg)
18.02%
ROE (avg)
25.01%

Valuation key factors

Factor
Value
P/E Ratio
58
Industry P/E
33
Price to Book Value
20.88
EV to EBIT
29.83
EV to EBITDA
25.45
EV to Capital Employed
6.09
EV to Sales
3.78
PEG Ratio
1.26
Dividend Yield
0.29%
ROCE (Latest)
19.07%
ROE (Latest)
31.91%

Technicals key factors

Indicator
Weekly
Monthly
MACD
Bullish
Bullish
RSI
Bearish
No Signal
Bollinger Bands
Mildly Bullish
Mildly Bullish
Moving Averages
Bullish (Daily)
KST
Bullish
Mildly Bearish
Dow Theory
Mildly Bearish
Bullish
OBV
No Trend
No Trend
stock-summary Technical Indicator Scale: Bearish, Mildly Bearish, Sideways, Mildly Bullish, Bullish  Turned 
stock-summaryShareholding
Shareholding Snapshot : Jun 2026stock-summary
Shareholding Compare (%holding) stock-summary
Majority shareholders

Promoters

Pledged Promoter Holdings

None

Mutual Funds

Held by 43 Schemes (16.29%)

FIIs

Held by 897 FIIs (20.45%)

Promoter with highest holding

Tvs Holdings Limited (formerly Known As Sundaram Clayton Limited) (50.26%)

Highest Public shareholder

Icici Mutual Fund (6.81%)

Individual Investors Holdings

6.45%

stock-summaryFinancial
[
  {
    "link": "quarterly",
    "btn_text": "All Quarterly Results",
    "header": "Quarterly Results Snapshot (Consolidated) - Jun'26 - QoQ",
    "rhs": [
      {
        "prefix": "Net Sales ",
        "suffix": "QoQ Growth in quarter ended Jun 2026 is 8.26% vs 2.01% in Mar 2026",
        "dir": 1
      },
      {
        "prefix": "Consolidated Net Profit ",
        "suffix": "QoQ Growth in quarter ended Jun 2026 is 32.13% vs -8.29% in Mar 2026",
        "dir": 1
      }
    ],
    "table": {
      "header": [
        "Jun'26",
        "Mar'26",
        "Change(%)"
      ],
      "body": [
        {
          "field": "Net Sales",
          "val1": "16,295.52",
          "val2": "15,052.73",
          "chgp": "8.26%",
          "chgp_class": "positive"
        },
        {
          "field": "Operating Profit (PBDIT) excl Other Income",
          "val1": "2,357.47",
          "val2": "2,186.91",
          "chgp": "7.80%",
          "chgp_class": "positive"
        },
        {
          "field": "Interest",
          "val1": "602.17",
          "val2": "565.82",
          "chgp": "6.42%",
          "chgp_class": "negative"
        },
        {
          "field": "Exceptional Items",
          "val1": "0.00",
          "val2": "0.00",
          "chgp": "",
          "chgp_class": "neutral"
        },
        {
          "field": "Consolidate Net Profit",
          "val1": "1,019.43",
          "val2": "771.52",
          "chgp": "32.13%",
          "chgp_class": "positive"
        },
        {
          "field": "Operating Profit Margin (Excl OI)",
          "val1": "14.47%",
          "val2": "14.53%",
          "chgp": "-0.06%",
          "chgp_class": "negative"
        }
      ]
    }
  },
  {
    "link": "half-yearly",
    "btn_text": "All Half Yearly Results",
    "header": "Half Yearly Results Snapshot (Consolidated) - Sep'25",
    "rhs": [
      {
        "prefix": "Net Sales ",
        "suffix": " Growth in half year ended Sep 2025 is 20.97% vs 14.33% in Sep 2024",
        "dir": 1
      },
      {
        "prefix": "Consolidated Net Profit ",
        "suffix": " Growth in half year ended Sep 2025 is 37.61% vs 24.46% in Sep 2024",
        "dir": 1
      }
    ],
    "table": {
      "header": [
        "Sep'25",
        "Sep'24",
        "Change(%)"
      ],
      "body": [
        {
          "field": "Net Sales",
          "val1": "26,261.27",
          "val2": "21,708.54",
          "chgp": "20.97%",
          "chgp_class": "positive"
        },
        {
          "field": "Operating Profit (PBDIT) excl Other Income",
          "val1": "3,936.20",
          "val2": "3,107.28",
          "chgp": "26.68%",
          "chgp_class": "positive"
        },
        {
          "field": "Interest",
          "val1": "1,102.95",
          "val2": "1,011.66",
          "chgp": "9.02%",
          "chgp_class": "negative"
        },
        {
          "field": "Exceptional Items",
          "val1": "0.00",
          "val2": "0.00",
          "chgp": "",
          "chgp_class": "neutral"
        },
        {
          "field": "Consolidate Net Profit",
          "val1": "1,405.52",
          "val2": "1,021.37",
          "chgp": "37.61%",
          "chgp_class": "positive"
        },
        {
          "field": "Operating Profit Margin (Excl OI)",
          "val1": "14.99%",
          "val2": "14.31%",
          "chgp": "0.68%",
          "chgp_class": "positive"
        }
      ]
    }
  },
  {
    "link": "nine-monthly",
    "btn_text": "All Nine Monthly Results",
    "header": "Nine Monthly Results Snapshot (Consolidated) - Dec'25",
    "rhs": [
      {
        "prefix": "Net Sales ",
        "suffix": "YoY Growth in nine months ended Dec 2025 is 25.27% vs 12.51% in Dec 2024",
        "dir": 1
      },
      {
        "prefix": "Consolidated Net Profit ",
        "suffix": "YoY Growth in nine months ended Dec 2025 is 41.54% vs 22.17% in Dec 2024",
        "dir": 1
      }
    ],
    "table": {
      "header": [
        "Dec'25",
        "Dec'24",
        "Change(%)"
      ],
      "body": [
        {
          "field": "Net Sales",
          "val1": "41,016.79",
          "val2": "32,743.42",
          "chgp": "25.27%",
          "chgp_class": "positive"
        },
        {
          "field": "Operating Profit (PBDIT) excl Other Income",
          "val1": "6,206.42",
          "val2": "4,761.45",
          "chgp": "30.35%",
          "chgp_class": "positive"
        },
        {
          "field": "Interest",
          "val1": "1,664.00",
          "val2": "1,547.75",
          "chgp": "7.51%",
          "chgp_class": "negative"
        },
        {
          "field": "Exceptional Items",
          "val1": "-50.08",
          "val2": "4.50",
          "chgp": "-1,212.89%",
          "chgp_class": "negative"
        },
        {
          "field": "Consolidate Net Profit",
          "val1": "2,246.81",
          "val2": "1,587.40",
          "chgp": "41.54%",
          "chgp_class": "positive"
        },
        {
          "field": "Operating Profit Margin (Excl OI)",
          "val1": "15.13%",
          "val2": "14.54%",
          "chgp": "0.59%",
          "chgp_class": "positive"
        }
      ]
    }
  },
  {
    "link": "annual",
    "btn_text": "All Annual Results",
    "header": "Annual Results Snapshot (Consolidated) - Mar'26",
    "rhs": [
      {
        "prefix": "Net Sales ",
        "suffix": "YoY Growth in year ended Mar 2026 is 27.17% vs 13.69% in Mar 2025",
        "dir": 1
      },
      {
        "prefix": "Consolidated Net Profit ",
        "suffix": "YoY Growth in year ended Mar 2026 is 35.01% vs 32.57% in Mar 2025",
        "dir": 1
      }
    ],
    "table": {
      "header": [
        "Mar'26",
        "Mar'25",
        "Change(%)"
      ],
      "body": [
        {
          "field": "Net Sales",
          "val1": "56,069.52",
          "val2": "44,089.01",
          "chgp": "27.17%",
          "chgp_class": "positive"
        },
        {
          "field": "Operating Profit (PBDIT) excl Other Income",
          "val1": "8,393.33",
          "val2": "6,648.72",
          "chgp": "26.24%",
          "chgp_class": "positive"
        },
        {
          "field": "Interest",
          "val1": "2,229.82",
          "val2": "2,093.25",
          "chgp": "6.52%",
          "chgp_class": "negative"
        },
        {
          "field": "Exceptional Items",
          "val1": "-50.08",
          "val2": "29.91",
          "chgp": "-267.44%",
          "chgp_class": "negative"
        },
        {
          "field": "Consolidate Net Profit",
          "val1": "3,018.33",
          "val2": "2,235.56",
          "chgp": "35.01%",
          "chgp_class": "positive"
        },
        {
          "field": "Operating Profit Margin (Excl OI)",
          "val1": "14.97%",
          "val2": "15.08%",
          "chgp": "-0.11%",
          "chgp_class": "negative"
        }
      ]
    }
  }
]

Quarterly Results Snapshot (Consolidated) - Jun'26 - QoQstock-summary

Jun'26
Mar'26
Change(%)
Net Sales
16,295.52
15,052.73
8.26%
Operating Profit (PBDIT) excl Other Income
2,357.47
2,186.91
7.80%
Interest
602.17
565.82
6.42%
Exceptional Items
0.00
0.00
Consolidate Net Profit
1,019.43
771.52
32.13%
Operating Profit Margin (Excl OI)
14.47%
14.53%
-0.06%
Values in Rs Cr.
Direction Arrows
Net Sales

QoQ Growth in quarter ended Jun 2026 is 8.26% vs 2.01% in Mar 2026

Direction Arrows
Consolidated Net Profit

QoQ Growth in quarter ended Jun 2026 is 32.13% vs -8.29% in Mar 2026

Half Yearly Results Snapshot (Consolidated) - Sep'25stock-summary

Sep'25
Sep'24
Change(%)
Net Sales
26,261.27
21,708.54
20.97%
Operating Profit (PBDIT) excl Other Income
3,936.20
3,107.28
26.68%
Interest
1,102.95
1,011.66
9.02%
Exceptional Items
0.00
0.00
Consolidate Net Profit
1,405.52
1,021.37
37.61%
Operating Profit Margin (Excl OI)
14.99%
14.31%
0.68%
Values in Rs Cr.
Direction Arrows
Net Sales

Growth in half year ended Sep 2025 is 20.97% vs 14.33% in Sep 2024

Direction Arrows
Consolidated Net Profit

Growth in half year ended Sep 2025 is 37.61% vs 24.46% in Sep 2024

Nine Monthly Results Snapshot (Consolidated) - Dec'25stock-summary

Dec'25
Dec'24
Change(%)
Net Sales
41,016.79
32,743.42
25.27%
Operating Profit (PBDIT) excl Other Income
6,206.42
4,761.45
30.35%
Interest
1,664.00
1,547.75
7.51%
Exceptional Items
-50.08
4.50
-1,212.89%
Consolidate Net Profit
2,246.81
1,587.40
41.54%
Operating Profit Margin (Excl OI)
15.13%
14.54%
0.59%
Values in Rs Cr.
Direction Arrows
Net Sales

YoY Growth in nine months ended Dec 2025 is 25.27% vs 12.51% in Dec 2024

Direction Arrows
Consolidated Net Profit

YoY Growth in nine months ended Dec 2025 is 41.54% vs 22.17% in Dec 2024

Annual Results Snapshot (Consolidated) - Mar'26stock-summary

Mar'26
Mar'25
Change(%)
Net Sales
56,069.52
44,089.01
27.17%
Operating Profit (PBDIT) excl Other Income
8,393.33
6,648.72
26.24%
Interest
2,229.82
2,093.25
6.52%
Exceptional Items
-50.08
29.91
-267.44%
Consolidate Net Profit
3,018.33
2,235.56
35.01%
Operating Profit Margin (Excl OI)
14.97%
15.08%
-0.11%
Values in Rs Cr.
Direction Arrows
Net Sales

YoY Growth in year ended Mar 2026 is 27.17% vs 13.69% in Mar 2025

Direction Arrows
Consolidated Net Profit

YoY Growth in year ended Mar 2026 is 35.01% vs 32.57% in Mar 2025

stock-summaryCompany CV
About TVS Motor Company Ltd stock-summary
stock-summary
TVS Motor Company Ltd
Large Cap
Automobiles
TVS Motor Company was initially incorporated as 'Sundaram Auto Engineers (India) Limited' on 10 June, 1992. Thereafter, the name was changed from Sundaram Auto Engineers (India) Limited to TVS Suzuki Limited on July 6, 2000 and subsequently it got changed from TVS Suzuki Limited to TVS Motor Company on 27 November, 2001. TVS Motor Company, the flagship company of TVS Group, is the third largest two-wheeler manufacturer in India.
Company Coordinates stock-summary
Company Details
Chaitanya No 12 Nungambakkam, Khader Nawaz Khan Road Chennai Tamil Nadu : 600034
stock-summary
Tel: 91-044-28332115
stock-summary
contactus@tvsmotor.com
Registrar Details
Sundaram-Clayton Ltd , Jayalakshmi Estates, 5th Floor, No 29 (Old 8), Post Box No. 732, Haddows Road, Chennai