
 Price Point
Compare TVS Motor Co. with Similar Stocks
ScoreDashboard
High Management Efficiency with a high ROCE of 16.32%
Healthy long term growth as Net Sales has grown by an annual rate of 22.10% and Operating profit at 31.27%
The company has declared Positive results for the last 11 consecutive quarters
High Institutional Holdings at 41.59%
Consistent Returns over the last 3 years
Mojo ParametersStock DNA

Automobiles

INR 196,506 Cr (Large Cap)

57.00
31

0.29%

2.90

31.91%

20.52
Total ReturnsTotal Returns (Price + Dividend) 
Latest dividend: 12.000000000000002 per share ex-dividend date: Mar-30-2026
Risk Adjusted Returns v/s
Returns Beta
 News & Corporate Actions
News
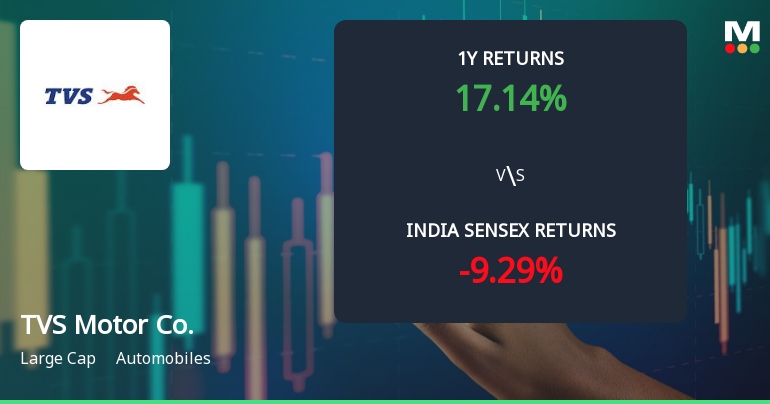
TVS Motor Company Ltd Technical Momentum Shifts Amid Mixed Indicator Signals
TVS Motor Company Ltd has experienced a nuanced shift in its technical momentum, moving from a bullish to a mildly bullish trend as of late September 2026. Despite a slight dip in daily price, key technical indicators such as MACD and moving averages continue to signal underlying strength, while others like RSI and Dow Theory present a more cautious outlook. This complex interplay of signals offers investors a detailed perspective on the stock’s near-term trajectory within the automobile sector.
Read full news article
MarketsMOJO Upgrades TVS Motor Company Ltd to Buy on Strong Technical and Financial Performance
TVS Motor Company Ltd has been upgraded from a Hold to a Buy rating by MarketsMOJO as of 21 Sep 2026, reflecting significant improvements across multiple evaluation parameters including quality, valuation, financial trends, and technical indicators. This upgrade comes amid robust quarterly results, strong long-term returns, and a bullish technical outlook, positioning the stock favourably within the automobile sector.
Read full news article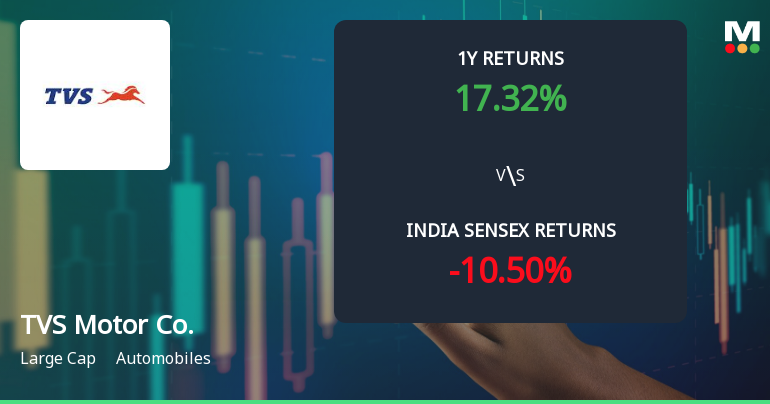
TVS Motor Company Ltd Technical Momentum Shifts Signal Bullish Outlook
TVS Motor Company Ltd has exhibited a notable shift in its technical momentum, moving from a mildly bullish stance to a more confident bullish trend. This transition is underscored by a confluence of positive signals from key technical indicators such as MACD, moving averages, and Bollinger Bands, despite some mixed readings from RSI and Dow Theory. Investors and analysts are closely monitoring these developments as the stock demonstrates resilience amid broader market fluctuations.
Read full news article Announcements
Shareholder Meeting / Postal Ballot-Notice of Postal Ballot
22-Sep-2026 | Source : BSENotice of Postal Ballot
Announcement under Regulation 30 (LODR)-Press Release / Media Release
17-Sep-2026 | Source : BSETVS Motor Company Raises the Bar this Festive Season with Enhancements to its Premium Motorcycle Portfolio
Announcement under Regulation 30 (LODR)-Press Release / Media Release
11-Sep-2026 | Source : BSETVS MOTOR COMPANY BRINGS THE NEXT GENERATION OF APACHE PERFORMANCE TO SRI LANKA WITH THE WHOLE RANGE
Corporate Actions

No Upcoming Board Meetings

TVS Motor Company Ltd has declared 1200% dividend, ex-date: 30 Mar 26

No Splits history available

TVS Motor Company Ltd has announced 4:1 bonus issue, ex-date: 25 Aug 25

No Rights history available
Key FactorsQuality key factors
Valuation key factors
Technicals key factors
 Technical Indicator Scale: Bearish, Mildly Bearish, Sideways, Mildly Bullish, Bullish Turned Shareholding
Shareholding Snapshot : Jun 2026
Shareholding Compare (%holding)
Promoters
None
Held by 43 Schemes (16.29%)
Held by 897 FIIs (20.45%)
Tvs Holdings Limited (formerly Known As Sundaram Clayton Limited) (50.26%)
Icici Mutual Fund (6.81%)
6.45%
FinancialQuarterly Results Snapshot (Consolidated) - Jun'26 - QoQ
 Compare with Peers
QoQ Growth in quarter ended Jun 2026 is 8.26% vs 2.01% in Mar 2026
QoQ Growth in quarter ended Jun 2026 is 32.13% vs -8.29% in Mar 2026

Half Yearly Results Snapshot (Consolidated) - Sep'25
Growth in half year ended Sep 2025 is 20.97% vs 14.33% in Sep 2024
Growth in half year ended Sep 2025 is 37.61% vs 24.46% in Sep 2024
Nine Monthly Results Snapshot (Consolidated) - Dec'25
YoY Growth in nine months ended Dec 2025 is 25.27% vs 12.51% in Dec 2024
YoY Growth in nine months ended Dec 2025 is 41.54% vs 22.17% in Dec 2024
Annual Results Snapshot (Consolidated) - Mar'26
YoY Growth in year ended Mar 2026 is 27.17% vs 13.69% in Mar 2025
YoY Growth in year ended Mar 2026 is 35.01% vs 32.57% in Mar 2025
 Company CV
About TVS Motor Company Ltd










