
Compare Twamev Constr. with Similar Stocks
Dashboard
Weak Long Term Fundamental Strength with a -7.93% CAGR growth in Net Sales over the last 5 years
- Low ability to service debt as the company has a high Debt to EBITDA ratio of 43.92 times
- The company has been able to generate a Return on Equity (avg) of 6.94% signifying low profitability per unit of shareholders funds
With a fall in Net Sales of -54.74%, the company declared Very Negative results in Mar 26
With ROCE of 1, it has a Very Expensive valuation with a 1 Enterprise value to Capital Employed
Underperformed the market in the last 1 year
Total Returns (Price + Dividend) 
Latest dividend: 1.5 per share ex-dividend date: Sep-27-2012
Risk Adjusted Returns v/s
Returns Beta

News

Twamev Construction & Infrastructure Ltd is Rated Strong Sell
Twamev Construction & Infrastructure Ltd is rated Strong Sell by MarketsMOJO. This rating was last updated on 24 December 2025, reflecting a significant reassessment of the stock’s outlook. However, the analysis and financial metrics presented here are based on the company’s current position as of 11 June 2026, providing investors with the latest insights into its performance and prospects.
Read full news article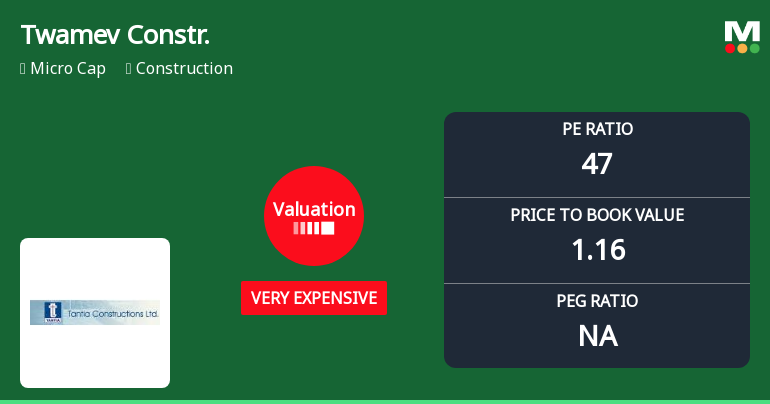
Twamev Construction & Infrastructure Ltd Valuation Shifts Signal Heightened Price Risk
Twamev Construction & Infrastructure Ltd has seen a marked shift in its valuation parameters, moving from an already expensive rating to a very expensive classification. This change, coupled with its micro-cap status and deteriorating financial metrics, raises concerns about the stock’s price attractiveness relative to its historical averages and peer group within the construction sector.
Read full news article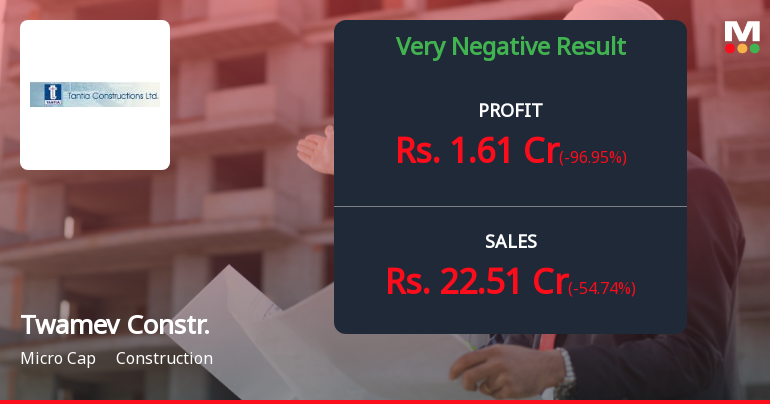
Twamev Construction Q4 FY26: Sharp Revenue Decline Overshadows Profit Stability
Twamev Construction & Infrastructure Ltd., a Kolkata-based civil infrastructure company, reported deeply concerning Q4 FY26 results that highlighted severe revenue challenges despite maintaining nominal profitability. The micro-cap construction firm posted net profit of ₹1.61 crores for the quarter ended March 2026, down 5.29% quarter-on-quarter and a staggering 96.95% year-on-year, as revenue collapsed 54.74% compared to the exceptional prior-year quarter.
Read full news article Announcements
Announcement under Regulation 30 (LODR)-Newspaper Publication
02-Jun-2026 | Source : BSENewspaper publication of Financial Results under Regulation 47 of SEBI (LODR) Regulations 2015
Compliances-Reg.24(A)-Annual Secretarial Compliance
30-May-2026 | Source : BSEAnnual Secretarial Compliance Report for the year ended March 2026.
Re-Appointment Of Cost Auditor Of The Company For The FY 2026-27
29-May-2026 | Source : BSERe-appointment of the cost auditor of the company for the FY 2026-27.
Corporate Actions

No Upcoming Board Meetings

Twamev Construction & Infrastructure Ltd has declared 15% dividend, ex-date: 27 Sep 12

No Splits history available

No Bonus history available

No Rights history available
Quality key factors
Valuation key factors
Technicals key factors
 Technical Indicator Scale: Bearish, Mildly Bearish, Sideways, Mildly Bullish, Bullish Turned
 Shareholding Snapshot : Mar 2026
Shareholding Compare (%holding)
Promoters
None
Held by 0 Schemes
Held by 2 FIIs (0.01%)
Ravi Todi (31.79%)
None
12.72%
Quarterly Results Snapshot (Consolidated) - Mar'26 - YoY

YoY Growth in quarter ended Mar 2026 is -54.74% vs 119.46% in Mar 2025
YoY Growth in quarter ended Mar 2026 is -96.95% vs 447.01% in Mar 2025
Half Yearly Results Snapshot (Consolidated) - Sep'25

Growth in half year ended Sep 2025 is 20.19% vs -10.04% in Sep 2024
Growth in half year ended Sep 2025 is 232.31% vs 117.15% in Sep 2024
Nine Monthly Results Snapshot (Consolidated) - Dec'25
YoY Growth in nine months ended Dec 2025 is 27.92% vs 15.60% in Dec 2024
YoY Growth in nine months ended Dec 2025 is 96.09% vs 143.98% in Dec 2024
Annual Results Snapshot (Consolidated) - Mar'26
YoY Growth in year ended Mar 2026 is -20.52% vs 59.96% in Mar 2025
YoY Growth in year ended Mar 2026 is -86.33% vs 351.94% in Mar 2025
About Twamev Construction & Infrastructure Ltd

Company Coordinates


