
Compare Ugro Capital with Similar Stocks
Dashboard
Negative results in Mar 26
- PAT(Latest six months) At Rs 35.93 cr has Grown at -53.97%
- PBT LESS OI(Q) At Rs 20.60 cr has Fallen at -27.6% (vs previous 4Q average)
- NON-OPERATING INCOME(Q) is 50.59 % of Profit Before Tax (PBT)
Consistent Underperformance against the benchmark over the last 3 years
Stock DNA
Non Banking Financial Company (NBFC)
INR 1,462 Cr (Small Cap)
13.00
20
0.00%
3.25
4.00%
0.51
Total Returns (Price + Dividend) 
Latest dividend: 3.5 per share ex-dividend date: Jun-25-2018
Risk Adjusted Returns v/s
Returns Beta

News

Ugro Capital Ltd is Rated Sell
Ugro Capital Ltd is rated Sell by MarketsMOJO, with this rating last updated on 16 Feb 2026. However, the analysis and financial metrics discussed here reflect the company’s current position as of 09 June 2026, providing investors with an up-to-date view of the stock’s fundamentals, valuation, financial trends, and technical outlook.
Read full news article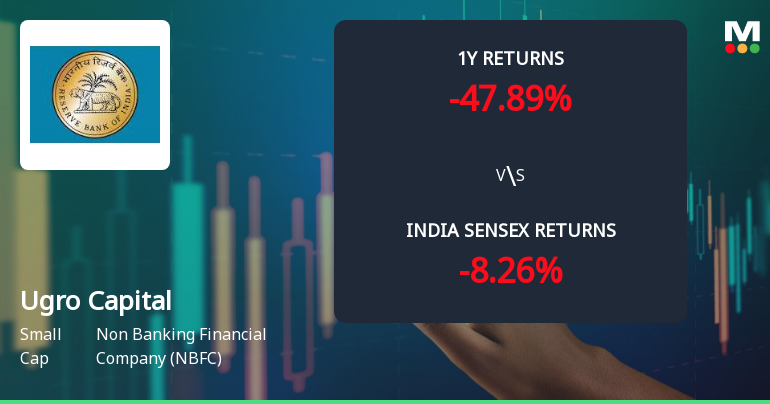
Ugro Capital Ltd Technical Momentum Shifts Amid Lingering Bearish Sentiment
Ugro Capital Ltd, a small-cap player in the Non Banking Financial Company (NBFC) sector, has experienced a subtle shift in its technical momentum, moving from a strongly bearish stance to a mildly bearish outlook. Despite this technical improvement, the stock continues to face significant headwinds, reflected in its subdued price performance and cautious market sentiment.
Read full news article
Ugro Capital Ltd is Rated Sell
Ugro Capital Ltd is rated Sell by MarketsMOJO, with this rating last updated on 16 Feb 2026. However, the analysis and financial metrics discussed here reflect the stock’s current position as of 28 May 2026, providing investors with the latest insights into its performance and outlook.
Read full news article Announcements
Shareholder Meeting / Postal Ballot-Outcome of AGM
03-Jun-2026 | Source : BSEConclusion time of 33rd Annual General Meeting of the Company
Shareholder Meeting / Postal Ballot-Scrutinizers Report
29-May-2026 | Source : BSEScrutinizers report of Annual General Meeting held on May 29 2026
Shareholder Meeting / Postal Ballot-Outcome of AGM
29-May-2026 | Source : BSEProceedings of the 33rd Annual General Meeting held on Friday 29th May 2026
Corporate Actions

No Upcoming Board Meetings

Ugro Capital Ltd has declared 35% dividend, ex-date: 25 Jun 18

No Splits history available

No Bonus history available

Ugro Capital Ltd has announced 50:189 rights issue, ex-date: 05 Jun 25
Quality key factors
Valuation key factors
Technicals key factors
 Technical Indicator Scale: Bearish, Mildly Bearish, Sideways, Mildly Bullish, Bullish Turned
 Shareholding Snapshot : Mar 2026
Shareholding Compare (%holding)
Non Institution
9.7654
Held by 1 Schemes (0.0%)
Held by 43 FIIs (22.33%)
Poshika Advisory Services Llp (1.31%)
Danish Sustainable Development Goals Investment Fund K S (15.78%)
23.64%
Quarterly Results Snapshot (Standalone) - Mar'26 - QoQ

QoQ Growth in quarter ended Mar 2026 is 19.34% vs -10.22% in Dec 2025
QoQ Growth in quarter ended Mar 2026 is 363.17% vs -85.27% in Dec 2025
Half Yearly Results Snapshot (Standalone) - Sep'25
Growth in half year ended Sep 2025 is 39.86% vs 35.77% in Sep 2024

Growth in half year ended Sep 2025 is 17.55% vs 21.71% in Sep 2024
Nine Monthly Results Snapshot (Standalone) - Dec'25
YoY Growth in nine months ended Dec 2025 is 28.77% vs 36.82% in Dec 2024
YoY Growth in nine months ended Dec 2025 is -18.93% vs 19.31% in Dec 2024
Annual Results Snapshot (Standalone) - Mar'26
YoY Growth in year ended Mar 2026 is 26.53% vs 33.20% in Mar 2025
YoY Growth in year ended Mar 2026 is -21.23% vs 20.60% in Mar 2025
About Ugro Capital Ltd

Company Coordinates


