
Compare Ultramarine Pig. with Similar Stocks
Stock DNA
Dyes And Pigments
INR 1,092 Cr (Micro Cap)
14.00
20
0.00%
0.03
9.06%
1.26
Total Returns (Price + Dividend) 
Latest dividend: 5 per share ex-dividend date: Jul-18-2024
Risk Adjusted Returns v/s
Returns Beta

News
Ultramarine & Pigments Ltd is Rated Sell
Ultramarine & Pigments Ltd is rated 'Sell' by MarketsMOJO, with this rating last updated on 11 February 2026. However, the analysis and financial metrics discussed here reflect the stock's current position as of 08 June 2026, providing investors with an up-to-date perspective on the company’s performance and outlook.
Read full news article
Ultramarine & Pigments Ltd is Rated Sell
Ultramarine & Pigments Ltd is rated Sell by MarketsMOJO, with this rating last updated on 11 February 2026. However, the analysis and financial metrics discussed here reflect the stock’s current position as of 08 June 2026, providing investors with an up-to-date view of the company’s fundamentals, returns, and market standing.
Read full news article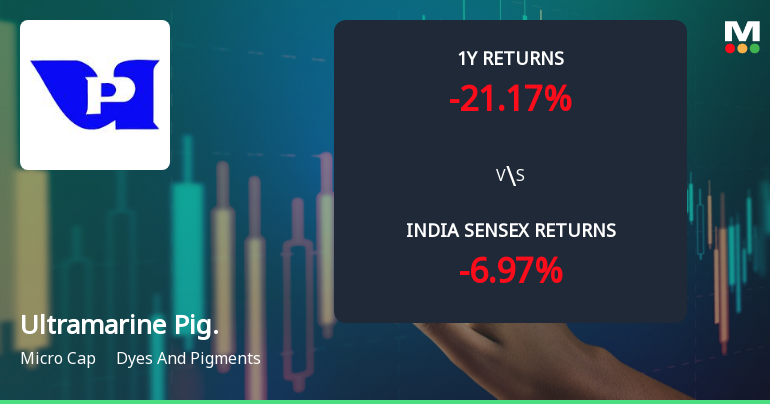
Ultramarine & Pigments Ltd Faces Bearish Momentum Amid Technical Downgrade
Ultramarine & Pigments Ltd, a micro-cap player in the Dyes and Pigments sector, has recently experienced a notable shift in its technical momentum, moving from a mildly bearish stance to a more pronounced bearish trend. This transition is underscored by mixed signals from key technical indicators such as MACD, RSI, Bollinger Bands, and moving averages, reflecting growing investor caution amid subdued price action.
Read full news article Announcements
Announcement under Regulation 30 (LODR)-Newspaper Publication
06-Jun-2026 | Source : BSENewspaper publication regarding notice to shareholders for the shares to be transferred to IEPF pursuant to the provisions of Investor Education and Protection Fund Authority (Accounting Audit Transfer and Refund) Rules 2016
Compliances-Reg.24(A)-Annual Secretarial Compliance
23-May-2026 | Source : BSEAnnual Secretarial Compliance report for the financial year 2025-26
Announcement under Regulation 30 (LODR)-Newspaper Publication
21-May-2026 | Source : BSENewspaper publication of the audited financial results for the quarter and year ended 31st March 2026
Corporate Actions

No Upcoming Board Meetings

Ultramarine & Pigments Ltd has declared 300% dividend, ex-date: 14 Jul 26

No Splits history available

No Bonus history available

No Rights history available
Quality key factors
Valuation key factors
Technicals key factors
 Technical Indicator Scale: Bearish, Mildly Bearish, Sideways, Mildly Bullish, Bullish Turned
 Shareholding Snapshot : Mar 2026
Shareholding Compare (%holding)
Non Institution
None
Held by 0 Schemes
Held by 5 FIIs (1.24%)
Thirumalai Chemicals Limited (14.38%)
Shivani Tejas Trivedi (2.08%)
47.61%
Quarterly Results Snapshot (Consolidated) - Mar'26 - YoY

YoY Growth in quarter ended Mar 2026 is 2.02% vs 43.61% in Mar 2025
YoY Growth in quarter ended Mar 2026 is -16.86% vs 56.58% in Mar 2025
Half Yearly Results Snapshot (Consolidated) - Sep'25

Growth in half year ended Sep 2025 is 18.36% vs 16.12% in Sep 2024
Growth in half year ended Sep 2025 is 12.43% vs 4.08% in Sep 2024
Nine Monthly Results Snapshot (Consolidated) - Dec'25
YoY Growth in nine months ended Dec 2025 is 15.22% vs 17.62% in Dec 2024
YoY Growth in nine months ended Dec 2025 is 14.84% vs 24.16% in Dec 2024
Annual Results Snapshot (Consolidated) - Mar'26
YoY Growth in year ended Mar 2026 is 11.52% vs 23.91% in Mar 2025
YoY Growth in year ended Mar 2026 is 7.62% vs 30.30% in Mar 2025
About Ultramarine & Pigments Ltd

Company Coordinates


