
Compare Kiri Industries with Similar Stocks
Dashboard
With a Operating Losses, the company has a Weak Long Term Fundamental Strength
- Company's ability to service its debt is weak with a poor EBIT to Interest (avg) ratio of -0.82
- The company has been able to generate a Return on Equity (avg) of 8.02% signifying low profitability per unit of shareholders funds
Risky - Negative EBITDA
Below par performance in long term as well as near term
Stock DNA
Dyes And Pigments
INR 2,563 Cr (Small Cap)
5.00
20
0.00%
-0.63
7.85%
0.40
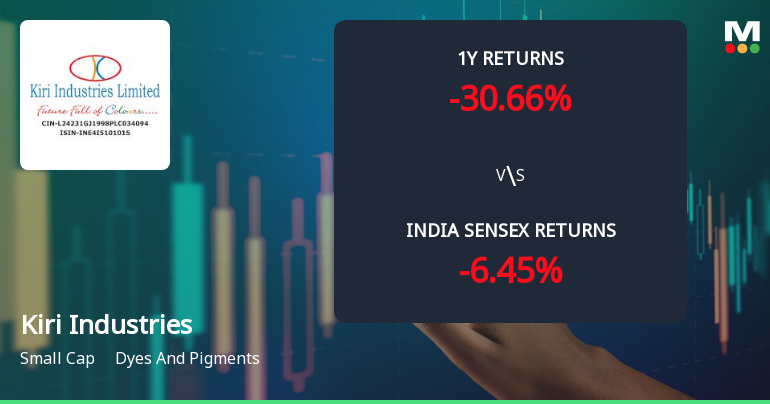
Total Returns (Price + Dividend) 
Latest dividend: 0.5 per share ex-dividend date: Sep-17-2020
Risk Adjusted Returns v/s
Returns Beta

News
Kiri Industries Ltd Technical Momentum Shifts Amid Bearish Outlook
Kiri Industries Ltd, a small-cap player in the Dyes and Pigments sector, has experienced a notable shift in its technical momentum, with key indicators signalling a transition from mildly bearish to a more pronounced bearish trend. Despite a modest day gain of 2.32%, the stock’s broader technical and fundamental outlook remains challenging, underscored by a recent downgrade to a Strong Sell rating by MarketsMOJO.
Read full news article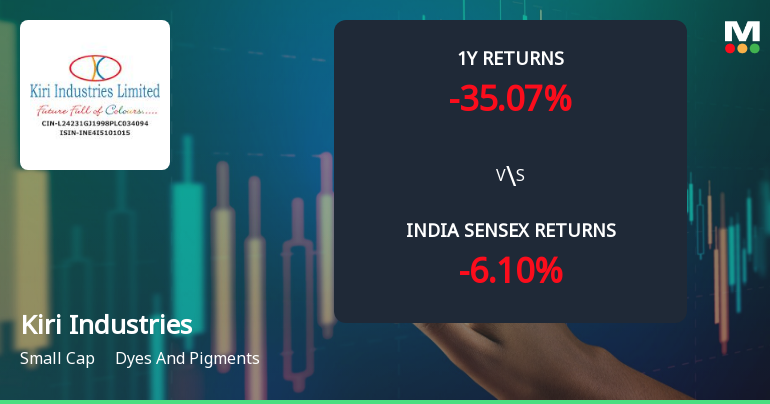
Kiri Industries Ltd Technical Momentum Shifts Amid Bearish Market Sentiment
Kiri Industries Ltd, a small-cap player in the Dyes and Pigments sector, has exhibited a nuanced shift in its technical momentum, reflecting a complex interplay of bearish and mildly bullish signals. Despite a recent downgrade to a Strong Sell rating, the stock’s technical indicators reveal mixed trends that warrant close scrutiny from investors navigating volatile market conditions.
Read full news article
Kiri Industries Ltd Faces Bearish Momentum Amid Technical Downturn
Kiri Industries Ltd, a small-cap player in the Dyes and Pigments sector, has experienced a notable shift in its technical momentum, with key indicators signalling a bearish trend despite some mildly bullish signals on shorter timeframes. The stock’s recent downgrade to a Strong Sell rating by MarketsMOJO reflects growing concerns over its price performance and underlying momentum.
Read full news article Announcements
Announcement under Regulation 30 (LODR)-Earnings Call Transcript
03-Jun-2026 | Source : BSEPlease find enclosed herewith Transcript of Q4-FY26/FY26 Earnings Conference Call held on Monday June 01 2026.
Announcement under Regulation 30 (LODR)-Analyst / Investor Meet - Outcome
01-Jun-2026 | Source : BSEPursuant to Regulation 30 of the SEBI (Listing Obligations and Disclosure Requirements) Regulations 2015 please find below the link of audio recording of Earnings Conference Call with Investors/ General Public held on Monday June 01 2026 at 10:30 AM (IST) on Group meet basis for discussion of Q4-FY26/FY26 results of the Company: Link: https://kiriindustries.com/wp-content/uploads/2026/06/Concall-KIRI-INDUSTRIES-LTD-01062026.mp3 You are kindly requested to take note of the same.
Announcement under Regulation 30 (LODR)-Change in Management
30-May-2026 | Source : BSEIntimation of Appointment of Internal Auditor for FY 2026-27.
Corporate Actions

No Upcoming Board Meetings

Kiri Industries Ltd has declared 5% dividend, ex-date: 17 Sep 20

No Splits history available

No Bonus history available

No Rights history available
Quality key factors
Valuation key factors
Technicals key factors
 Technical Indicator Scale: Bearish, Mildly Bearish, Sideways, Mildly Bullish, Bullish Turned
 Shareholding Snapshot : Apr 2026
Shareholding Compare (%holding)
Promoters
0.2191
Held by 1 Schemes (0.0%)
Held by 46 FIIs (16.87%)
Anupama Manishkumar Kiri (14.58%)
Griffin Growth Fund Vcc (5.11%)
28.78%
Quarterly Results Snapshot (Consolidated) - Mar'26 - QoQ

QoQ Growth in quarter ended Mar 2026 is 44.31% vs -18.67% in Dec 2025

QoQ Growth in quarter ended Mar 2026 is -89.76% vs 25,457.30% in Dec 2025
Half Yearly Results Snapshot (Consolidated) - Sep'25
Growth in half year ended Sep 2025 is -22.67% vs 17.37% in Sep 2024
Growth in half year ended Sep 2025 is -81.21% vs 875.32% in Sep 2024
Nine Monthly Results Snapshot (Consolidated) - Dec'25
YoY Growth in nine months ended Dec 2025 is -17.72% vs 15.98% in Dec 2024
YoY Growth in nine months ended Dec 2025 is 1,406.29% vs 122.37% in Dec 2024
Annual Results Snapshot (Consolidated) - Mar'26
YoY Growth in year ended Mar 2026 is 13.46% vs 4.43% in Mar 2025
YoY Growth in year ended Mar 2026 is 2,002.80% vs 59.26% in Mar 2025
About Kiri Industries Ltd

Company Coordinates


