
Compare Unicommerce with Similar Stocks
Stock DNA
Software Products
INR 1,041 Cr (Micro Cap)
50.00
20
0.00%
-0.15
10.60%
5.31
Total Returns (Price + Dividend) 
Unicommerce for the last several years.
Risk Adjusted Returns v/s
Returns Beta

News

Unicommerce eSolutions Ltd is Rated Sell
Unicommerce eSolutions Ltd is rated Sell by MarketsMOJO, with this rating last updated on 27 April 2026. However, the analysis and financial metrics discussed here reflect the company’s current position as of 10 June 2026, providing investors with the latest insights into its performance and outlook.
Read full news article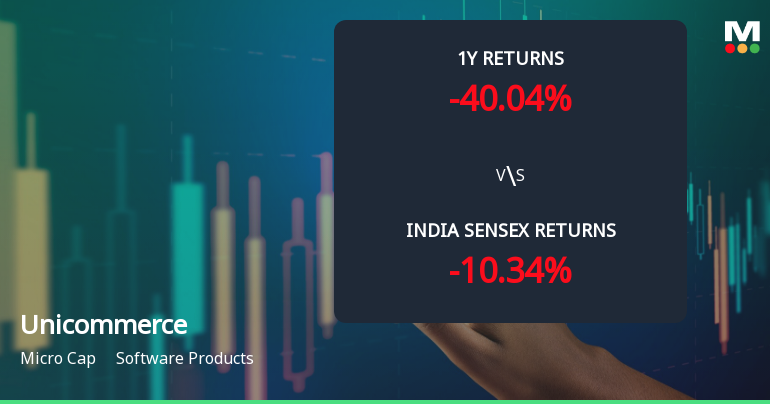
Unicommerce eSolutions Ltd Technical Momentum Shifts Amid Bearish Sentiment
Unicommerce eSolutions Ltd, a micro-cap player in the Software Products sector, has experienced a notable shift in its technical momentum, reflecting a complex interplay of bearish and mildly bullish signals. Despite a recent 1.33% gain to ₹85.15, the stock remains under pressure with a downgraded Mojo Grade from Hold to Sell, underscoring ongoing challenges in price momentum and market sentiment.
Read full news article
Unicommerce eSolutions Ltd Faces Bearish Momentum Amid Technical Downgrade
Unicommerce eSolutions Ltd, a micro-cap player in the Software Products sector, has experienced a notable shift in its technical momentum, with key indicators signalling a bearish trend. The stock’s recent price action and technical parameters suggest increasing downside pressure, reflecting broader challenges in the company’s market performance relative to benchmarks such as the Sensex.
Read full news article Announcements
Announcement under Regulation 30 (LODR)-Press Release / Media Release
11-Jun-2026 | Source : BSEUnicommerce eSolutions Limited has informed the exchange about the press release titled Opptra Partners with Unicommerce to Scale Consumer Brands Across India GCC & Southeast Asia
Announcement under Regulation 30 (LODR)-Resignation of Chairman
09-Jun-2026 | Source : BSEUpdate on intimation filed under Regulation 30 of the SEBI (Listing Obligations and Disclosure Requirements) Regulations 2015
Announcement under Regulation 30 (LODR)-Analyst / Investor Meet - Intimation
08-Jun-2026 | Source : BSEAnalyst/Investor Conference Call
Corporate Actions

No Upcoming Board Meetings

No Dividend history available

No Splits history available

No Bonus history available

No Rights history available
Quality key factors
Valuation key factors
Technicals key factors
 Technical Indicator Scale: Bearish, Mildly Bearish, Sideways, Mildly Bullish, Bullish Turned
 Shareholding Snapshot : Mar 2026
Shareholding Compare (%holding)
Non Institution
None
Held by 4 Schemes (3.82%)
Held by 5 FIIs (0.15%)
Acevector Limited (25.9%)
Sb Investment Holdings Uk Limited (14.39%)
37.17%
Quarterly Results Snapshot (Consolidated) - Mar'26 - QoQ

QoQ Growth in quarter ended Mar 2026 is -8.44% vs 9.75% in Dec 2025
QoQ Growth in quarter ended Mar 2026 is -53.99% vs 27.85% in Dec 2025
Half Yearly Results Snapshot (Standalone) - Sep'25
Growth in half year ended Sep 2025 is 1.07% vs 11.14% in Sep 2024

Growth in half year ended Sep 2025 is 60.33% vs 25.43% in Sep 2024
Nine Monthly Results Snapshot (Standalone) - Dec'25
YoY Growth in nine months ended Dec 2025 is 3.46% vs 11.94% in Dec 2024
YoY Growth in nine months ended Dec 2025 is 42.93% vs 42.73% in Dec 2024
Annual Results Snapshot (Consolidated) - Mar'26
YoY Growth in year ended Mar 2026 is 51.60% vs 30.13% in Mar 2025
YoY Growth in year ended Mar 2026 is 15.72% vs 34.76% in Mar 2025
About Unicommerce eSolutions Ltd

Company Coordinates


