
Compare Quick Heal Tech with Similar Stocks
Dashboard
With a Operating Losses, the company has a Weak Long Term Fundamental Strength
- The company has been able to generate a Return on Equity (avg) of 4.29% signifying low profitability per unit of shareholders funds
The company declared negative results in Mar'26 after flat results in Dec'25
Risky - Negative EBITDA
Falling Participation by Institutional Investors
Below par performance in long term as well as near term
Stock DNA
Software Products
INR 915 Cr (Small Cap)
NA (Loss Making)
20
0.00%
-0.50
-2.50%
2.10
Total Returns (Price + Dividend) 
Latest dividend: 3 per share ex-dividend date: Aug-30-2024
Risk Adjusted Returns v/s
Returns Beta

News

Quick Heal Technologies Ltd Technical Momentum Shifts Amid Bearish Market Sentiment
Quick Heal Technologies Ltd, a small-cap player in the Software Products sector, continues to grapple with a challenging market environment as its technical indicators reveal a complex picture of price momentum. Despite some mildly bullish signals on shorter-term charts, the stock remains entrenched in a broader bearish trend, reflecting ongoing investor caution and subdued performance relative to benchmark indices.
Read full news article
Quick Heal Technologies Ltd is Rated Strong Sell
Quick Heal Technologies Ltd is rated Strong Sell by MarketsMOJO, with this rating last updated on 22 May 2026. However, the analysis and financial metrics discussed here reflect the stock’s current position as of 12 July 2026, providing investors with the latest insights into the company’s fundamentals, valuation, financial trends, and technical outlook.
Read full news article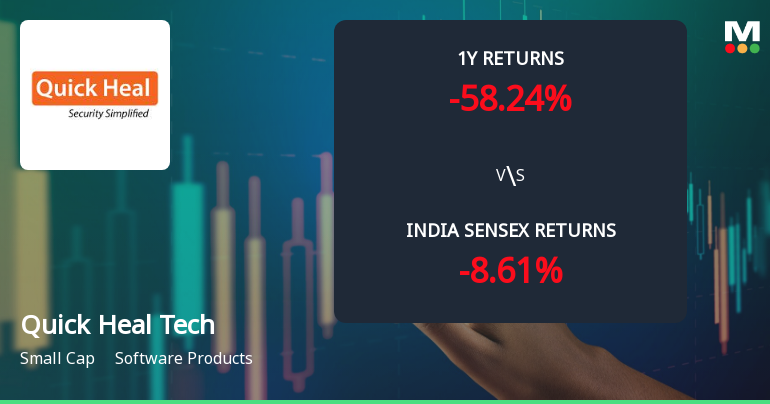
Quick Heal Technologies Ltd Faces Intensified Bearish Momentum Amid Technical Downgrade
Quick Heal Technologies Ltd, a small-cap player in the Software Products sector, has seen a marked shift in its technical momentum, with key indicators signalling a deepening bearish trend. The company’s share price has declined sharply over recent months, underperforming the broader Sensex and prompting a downgrade in its Mojo Grade to Strong Sell as of 10 April 2026.
Read full news article Announcements
Quick Heal Technologies Limited - Other General Purpose
26-Nov-2019 | Source : NSEQuick Heal Technologies Limited has informed the Exchange regarding Related Party Transaction for the half year ended September 30, 2019.
Quick Heal Technologies Limited - Press Release
18-Nov-2019 | Source : NSEQuick Heal Technologies Limited has informed the Exchange regarding a press release dated November 16, 2019, titled "Newspaper advertisement pertaining to financial results of the Company".
Quick Heal Technologies Limited - Outcome of Board Meeting
15-Nov-2019 | Source : NSEQuick Heal Technologies Limited has informed the Exchange regarding Board meeting held on November 14, 2019.
Corporate Actions

No Upcoming Board Meetings

Quick Heal Technologies Ltd has declared 30% dividend, ex-date: 30 Aug 24

No Splits history available

No Bonus history available

No Rights history available
Quality key factors
Valuation key factors
Technicals key factors
 Technical Indicator Scale: Bearish, Mildly Bearish, Sideways, Mildly Bullish, Bullish Turned
 Shareholding Snapshot : Mar 2026
Shareholding Compare (%holding)
Promoters
None
Held by 1 Schemes (0.0%)
Held by 9 FIIs (0.73%)
Sanjay Sahebrao Katkar (28.74%)
Jatinder Agarwal (1.47%)
21.76%
Quarterly Results Snapshot (Consolidated) - Mar'26 - YoY

YoY Growth in quarter ended Mar 2026 is -25.19% vs -18.61% in Mar 2025
YoY Growth in quarter ended Mar 2026 is -513.54% vs -123.15% in Mar 2025
Half Yearly Results Snapshot (Consolidated) - Sep'25
Growth in half year ended Sep 2025 is -2.11% vs 10.77% in Sep 2024
Growth in half year ended Sep 2025 is -70.66% vs 5,742.86% in Sep 2024
Nine Monthly Results Snapshot (Consolidated) - Dec'25
YoY Growth in nine months ended Dec 2025 is -0.98% vs 1.26% in Dec 2024

YoY Growth in nine months ended Dec 2025 is 8.69% vs -18.73% in Dec 2024
Annual Results Snapshot (Consolidated) - Mar'26
YoY Growth in year ended Mar 2026 is -6.62% vs -4.19% in Mar 2025
YoY Growth in year ended Mar 2026 is -316.87% vs -79.21% in Mar 2025
About Quick Heal Technologies Ltd

Company Coordinates


