
Compare Uniparts India with Similar Stocks
Dashboard
The company is Net-Debt Free
With a growth in Net Profit of 53.51%, the company declared Very Positive results in Mar 26
With ROE of 18.5, it has a Very Attractive valuation with a 3.4 Price to Book Value
Increasing Participation by Institutional Investors
Market Beating Performance
Stock DNA
Auto Components & Equipments
INR 2,979 Cr (Small Cap)
18.00
36
5.72%
-0.11
18.48%
3.42
Total Returns (Price + Dividend) 
Latest dividend: 7 per share ex-dividend date: Feb-16-2026
Risk Adjusted Returns v/s
Returns Beta

News
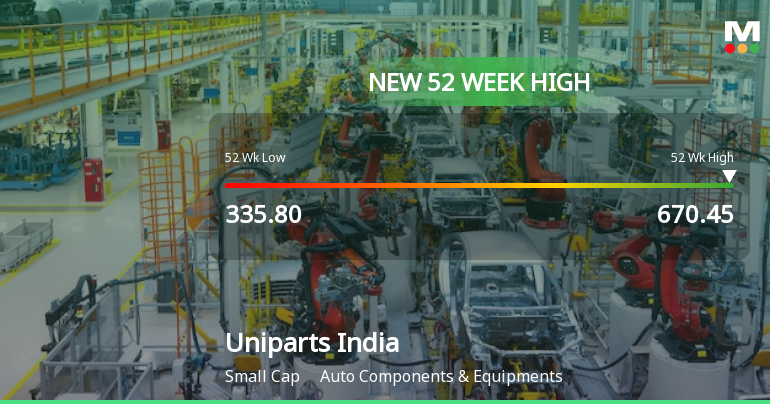
Broad-Based Technical Strength Lifts Uniparts India Ltd to 52-Week High of Rs 670.45
Surging to a new 52-week high of Rs 670.45 on 15 Jun 2026, Uniparts India Ltd has demonstrated remarkable price momentum, outperforming the broader market with a 68.31% gain over the past year against the Sensex’s decline of 5.52%. This milestone reflects a confluence of strong technical signals and sustained earnings growth that have propelled the stock well above its 52-week low of Rs 335.80.
Read full news article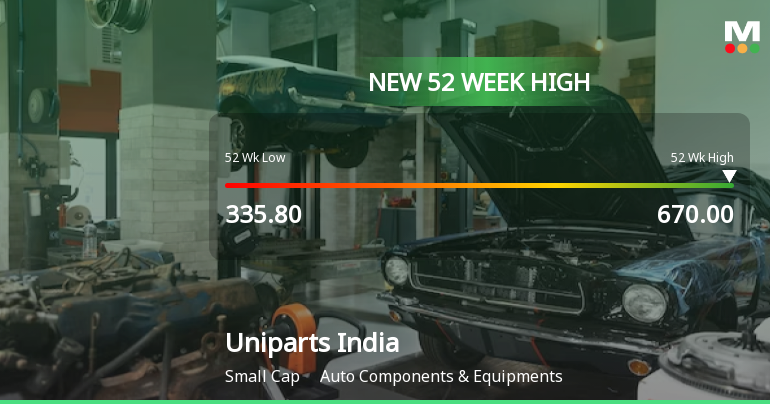
Broad-Based Technical Strength Lifts Uniparts India Ltd to 52-Week High of Rs 670
With a decisive surge to Rs 670 on 10 Jun 2026, Uniparts India Ltd has reached a fresh 52-week high, marking a remarkable 79.8% gain over the past year. This milestone is underpinned by a confluence of strong technical signals and sustained momentum, setting the stock apart in a market where the Sensex has declined nearly 10% over the same period.
Read full news article
Uniparts India Ltd is Rated Strong Buy
Uniparts India Ltd is rated Strong Buy by MarketsMOJO, with this rating last updated on 08 June 2026. However, the analysis and financial metrics discussed here reflect the company’s current position as of 09 June 2026, providing investors with the most up-to-date insight into the stock’s performance and outlook.
Read full news article Announcements
Announcement under Regulation 30 (LODR)-Analyst / Investor Meet - Intimation
09-Jun-2026 | Source : BSESchedule of one to one meeting with Investor(s)/Analyst(s)
Announcement under Regulation 30 (LODR)-Analyst / Investor Meet - Intimation
09-Jun-2026 | Source : BSESchedule of meeting with Investor/Analyst
Announcement under Regulation 30 (LODR)-Analyst / Investor Meet - Intimation
08-Jun-2026 | Source : BSESchedule of one to one meetings with Investor(s)/Analyst(s)
Corporate Actions

No Upcoming Board Meetings

Uniparts India Ltd has declared 70% dividend, ex-date: 16 Feb 26

No Splits history available

No Bonus history available

No Rights history available
Quality key factors
Valuation key factors
Technicals key factors
 Technical Indicator Scale: Bearish, Mildly Bearish, Sideways, Mildly Bullish, Bullish Turned
 Shareholding Snapshot : Mar 2026
Shareholding Compare (%holding)
Promoters
None
Held by 4 Schemes (1.45%)
Held by 45 FIIs (2.82%)
Gurdeep Soni (19.93%)
Aditya Birla Sun Life Insurance Company Limited (2.46%)
19.38%
Quarterly Results Snapshot (Consolidated) - Mar'26 - QoQ

QoQ Growth in quarter ended Mar 2026 is 20.62% vs 1.51% in Dec 2025
QoQ Growth in quarter ended Mar 2026 is 53.51% vs -15.41% in Dec 2025
Half Yearly Results Snapshot (Consolidated) - Sep'25
Growth in half year ended Sep 2025 is 9.53% vs -14.88% in Sep 2024
Growth in half year ended Sep 2025 is 60.40% vs -34.33% in Sep 2024
Nine Monthly Results Snapshot (Consolidated) - Dec'25
YoY Growth in nine months ended Dec 2025 is 16.96% vs -16.33% in Dec 2024
YoY Growth in nine months ended Dec 2025 is 64.42% vs -32.15% in Dec 2024
Annual Results Snapshot (Consolidated) - Mar'26
YoY Growth in year ended Mar 2026 is 21.45% vs -15.43% in Mar 2025
YoY Growth in year ended Mar 2026 is 79.91% vs -29.42% in Mar 2025
About Uniparts India Ltd

Company Coordinates


