Uniphos Enter.

  • Market Cap: Micro Cap
  • Industry: Miscellaneous
  • ISIN: INE037A01022
  • NSEID: UNIENTER
  • BSEID: 500429
INR
102.55
0.25 (0.24%)
BSENSE

Jun 12, 03:30 PM

BSE+NSE Vol: 8.32 k

  • Price Points
  • Score
  • Mojo Parameters
  • Total Return
  • News and Corporate Actions
  • Key factors
  • Shareholding
  • Financials
  • CompanyCV
stock-summaryPrice Point
High/Low

1Day

52 Week

Valuation
Technical
Day's Volume

CASH

8.32 k (149.30%) Volume

Shareholding (Mar 2026)

FII

15.82%

Held by 15 FIIs

DII

0.00%

Held by 1 DIIs

Promoter

73.79%

Why is Uniphos Enterprises Ltd falling/rising?

12-Jun-2026

As of 11-Jun, Uniphos Enterprises Ltd's stock price is declining, currently at 102.30, with a year-to-date drop of 30.12% and a one-year decline of 33.74%. The stock is experiencing high volatility and decreasing investor participation, contributing to its bearish trend.

As of 11-Jun, Uniphos Enterprises Ltd's stock price is falling, currently at 102.30, which reflects a decrease of 1.75 or 1.68%. The stock has been experiencing a consecutive decline over the past two days, with a total drop of 2.9% during this period. Additionally, the stock has shown poor performance over various time frames, including a year-to-date decline of 30.12% and a one-year drop of 33.74%, significantly underperforming the benchmark Sensex, which has only decreased by 13.36% and 10.52% over the same periods.<BR><BR>Today's trading has been characterized by high volatility, with an intraday volatility of 7.25%. The stock reached a high of Rs 109.95 but also fell to a low of Rs 101.5, indicating significant fluctuations within the trading day. Furthermore, Uniphos Enterprises Ltd is trading below its moving averages across multiple time frames, including the 5-day, 20-day, 50-day, 100-day, and 200-day averages, which typically suggests a bearish trend.<BR><BR>Investor participation appears to be declining, as evidenced by a drop in delivery volume by 5.38% compared to the 5-day average. This decrease in trading activity may further contribute to the stock's downward pressure. Overall, the combination of poor historical performance, high volatility, and falling investor participation are key factors contributing to the decline in Uniphos Enterprises Ltd's stock price.

View full answer

How big is Uniphos Enter.?

11-Jun-2026

As of 10th June, Uniphos Enterprises Ltd has a market capitalization of 725.00 Cr, with recent net sales of 32.00 Cr and a net profit of 20.71 Cr.

As of 10th June, Uniphos Enterprises Ltd has a market capitalization of 725.00 Cr, categorizing it as a Micro Cap company.<BR><BR>In the latest four quarters, Uniphos Enterprises Ltd reported Net Sales of 32.00 Cr and a Net Profit of 20.71 Cr.<BR><BR>The latest annual period for the balance sheet is March 2025, with Shareholder's Funds amounting to 2,741.65 Cr and Total Assets of 2,841.71 Cr.

View full answer

Who are in the management team of Uniphos Enter.?

11-Jun-2026

The management team of Uniphos Enterprises includes R D Shroff (Managing Director), S R Shroff (Vice Chairperson), J R Shroff (Non-Executive Director), A C Ashar (Chairman), Pradeep Goyal and Swati S Mayekar (Non-Executive Independent Directors), and K M Thacker (Company Secretary). They oversee the company's operations and strategic direction.

The management team of Uniphos Enterprises includes the following individuals:<BR><BR>1. R D Shroff - Managing Director<BR>2. S R Shroff - Vice Chairperson<BR>3. J R Shroff - Non-Executive & Non-Independent Director<BR>4. A C Ashar - Chairman (Non-Executive)<BR>5. Pradeep Goyal - Non-Executive & Independent Director<BR>6. Swati S Mayekar - Non-Executive & Independent Director<BR>7. K M Thacker - Company Secretary & Compliance Officer<BR><BR>This team is responsible for overseeing the company's operations and strategic direction.

View full answer

Who are the peers of the Uniphos Enter.?

11-Jun-2026

Uniphos Enter.'s peers include Creative Newtech, Kokuyo Camlin, R M Drip & Sprin, Linc, and others. In terms of management risk, growth, and capital structure, Uniphos Enter. shows below average performance compared to its peers.

Peers: The peers of Uniphos Enter. are Creative Newtech, Kokuyo Camlin, R M Drip & Sprin, Linc, Everest Inds., Vision Infra, Vasa Denticity, Kapston Services, Tembo Global, and Namo eWaste.<BR><BR>Quality Snapshot: Excellent management risk is observed at Creative Newtech, R M Drip & Sprin, Linc, Tembo Global, and Namo eWaste, while Average management risk is found at Kokuyo Camlin, Uniphos Enter., Vision Infra, Kapston Services, and the rest. Good growth is seen at Kokuyo Camlin, Linc, Vision Infra, Kapston Services, and Tembo Global, whereas Uniphos Enter. shows below average growth, and the rest have either excellent or average growth. For capital structure, Excellent is noted at Linc and Vasa Denticity, Good at Kokuyo Camlin and Linc, while Uniphos Enter. has below average capital structure, and the rest have varying ratings.<BR><BR>Return Snapshot: The peer with the highest 1-year return is Creative Newtech with N/A, while the peer with the lowest is Kokuyo Camlin at -35.12%. Uniphos Enter.'s 1-year return is -28.79%, which is better than Kokuyo Camlin but worse than Creative Newtech. Additionally, Everest Inds. has a negative six-month return of -33.51%, and Linc, Vision Infra, Vasa Denticity, Kapston Services, Tembo Global, and Namo eWaste have zero returns over the same period.

View full answer

What does Uniphos Enter. do?

10-Jun-2026

Uniphos Enterprises Ltd is a micro-cap company specializing in the manufacturing of specialty chemicals, including phosphorus compounds and pesticides. As of March 2026, it reported net sales of 26 Cr and a net loss of 1 Cr, with a market cap of INR 725 Cr.

Overview:<BR>Uniphos Enterprises Ltd is a micro-cap company in the miscellaneous industry, primarily engaged in the manufacturing of specialty chemicals, including phosphorus compounds, pesticides, dyes, and mercury salts.<BR><BR>History:<BR>Established in 1969 as United Phosphorus Limited, the company has evolved from producing red phosphorus to becoming a significant manufacturer and exporter of organic and inorganic mercury compounds in India. The latest quarterly results reported net sales and profit for the period ending March 2026.<BR><BR>Financial Snapshot:<BR>- Most recent Net Sales: 26 Cr (Quarterly Results - Mar 2026)<BR>- Most recent Net Profit: -1 Cr (Quarterly Results - Mar 2026)<BR>- Market-cap value: INR 725 Cr (Micro Cap)<BR><BR>Key Metrics:<BR>- P/E: 35.00<BR>- Industry P/E: 21<BR>- Dividend Yield: 0.47%<BR>- Debt Equity: -0.01<BR>- Return on Equity: 0.85%<BR>- Price to Book: 0.30<BR><BR>Contact Details:<BR>Address: 11 GIDC, Valsad Dist VAPI Gujarat : 396195 <BR>Tel: 91-0260-2400717 <BR>Email: thackerkm@uniphos.com <BR>Website: http://www.uelonline.com

View full answer

Should I buy, sell or hold Uniphos Enterprises Ltd?

30-May-2026

Are Uniphos Enterprises Ltd latest results good or bad?

29-May-2026

Uniphos Enterprises Ltd's latest Q4 FY26 results are unfavorable, showing a net loss of ₹0.70 crores and a significant 64.14% decline in revenue year-over-year. Despite a slight improvement in losses compared to last year, the company's negative margins and low return on equity indicate ongoing operational challenges.

Uniphos Enterprises Ltd's latest results for Q4 FY26 indicate a challenging financial situation. The company reported a net loss of ₹0.70 crores, which, while an improvement from a loss of ₹1.58 crores in the same quarter last year, still reflects ongoing operational weaknesses. Revenue for the quarter was ₹26.14 crores, marking a significant decline of 64.14% year-over-year from ₹72.90 crores in Q4 FY25.<BR><BR>The company's profitability metrics remain concerning, with a negative PAT margin of -2.68%, which is worse than the previous year's -2.17%. Additionally, the return on equity (ROE) is extremely low at 0.73%, indicating poor capital efficiency. The overall financial performance has been erratic, with extreme revenue volatility and persistent losses raising serious questions about the company's business model and viability.<BR><BR>In summary, while there is a slight narrowing of losses compared to the previous year, the overall financial results are poor, characterized by significant revenue decline, negative margins, and weak operational performance. This paints a picture of a company facing substantial challenges, making the latest results largely unfavorable.

View full answer

When is the next results date for Uniphos Enterprises Ltd?

21-May-2026

The next results date for Uniphos Enterprises Ltd is 27 May 2026.

The next results date for Uniphos Enterprises Ltd is scheduled for 27 May 2026.

View full answer

Is Uniphos Enter. technically bullish or bearish?

05-Dec-2025

As of December 4, 2025, the technical trend has shifted to a moderately strong bearish stance, driven by bearish MACD, Bollinger Bands, and moving averages, despite a mildly bullish OBV signal on the monthly chart.

As of 4 December 2025, the technical trend has changed from mildly bearish to bearish. The current stance is bearish with a moderate strength. Key indicators driving this include a bearish MACD on the weekly timeframe, bearish signals from Bollinger Bands on both weekly and monthly charts, and bearish moving averages on the daily chart. The KST is also bearish across both timeframes. Although the OBV shows a mildly bullish signal on the monthly, it does not outweigh the overall bearish indicators.

View full answer

How has been the historical performance of Uniphos Enter.?

12-Nov-2025

Uniphos Enter. has shown significant sales growth, with net sales rising from 1.47 Cr in March 2023 to 111.51 Cr in March 2025. However, it faces profitability challenges, as operating profit declined and cash flow from operations remained negative.

Answer:<BR>The historical performance of Uniphos Enter. shows significant fluctuations in its financial metrics over the years, particularly from March 2019 to March 2025.<BR><BR>Breakdown:<BR>Uniphos Enter. experienced a dramatic increase in net sales from 1.47 Cr in March 2023 to 111.51 Cr in March 2025, reflecting a substantial growth trajectory. However, the total expenditure also rose sharply, leading to an operating profit (PBDIT) of 2.29 Cr in March 2025, down from 39.78 Cr in March 2024. This decline in operating profit is accompanied by a negative operating profit margin of -3.43% in March 2025, indicating challenges in managing costs relative to revenue. Profit before tax decreased to 0.23 Cr in March 2025 from 38.94 Cr in March 2024, while profit after tax also fell to 0.28 Cr from 38.61 Cr in the previous year. The company's reserves increased to 2,727.74 Cr in March 2025, up from 2,061.54 Cr in March 2024, yet the book value per share adjusted to 373.37 in March 2025 from 277.58 in March 2024. Cash flow from operating activities remained negative at -2.00 Cr in March 2025, although cash flow from investing activities improved to 52.00 Cr. Overall, while Uniphos Enter. has shown remarkable sales growth, it faces challenges in profitability and cash flow management.

View full answer

Who are the top shareholders of the Uniphos Enter.?

17-Jul-2025

The top shareholders of Uniphos Enterprises include Nerka Chemicals Pvt Ltd with 73.29%, 15 Foreign Institutional Investors holding 15.72%, and Ares Diversified as the largest public shareholder at 4.56%. Individual investors own 8.91%, with no pledged promoter holdings reported.

The top shareholders of Uniphos Enterprises include the promoters, with Nerka Chemicals Pvt Ltd holding the largest share at 73.29%. Additionally, 15 Foreign Institutional Investors (FIIs) collectively hold 15.72% of the shares. The highest public shareholder is Ares Diversified, which owns 4.56%. Individual investors account for 8.91% of the shareholding. There are no pledged promoter holdings reported.

View full answer

Has Uniphos Enter. declared dividend?

06-Jun-2025

Uniphos Enterprises Ltd has declared a 285% dividend, amounting to ₹5.7 per share, with an ex-date of September 6, 2024. The company has shown strong total returns across various periods, particularly a 225.14% total return over the past five years.

Uniphos Enterprises Ltd has declared a 285% dividend.<BR><BR>Dividend Details:<BR>- Percentage announced: 285%<BR>- Amount per share: 5.7<BR>- Ex-date: 06 Sep 2024<BR><BR>Dividend Yield: 3.56%.<BR><BR>Total Returns by Period:<BR>In the 6-month period, the price return was 0.95%, with no dividend return, resulting in a total return of 0.95%.<BR><BR>For the 1-year period, the price return was 0.25%, with a dividend return of 3.45%, leading to a total return of 3.7%.<BR><BR>Over the 2-year period, the price return was 4.95%, the dividend return was 7.66%, culminating in a total return of 12.61%.<BR><BR>In the 3-year period, the price return was 28.23%, with a dividend return of 14.76%, resulting in a total return of 42.99%.<BR><BR>During the 4-year period, the price return was 32.78%, the dividend return was 16.29%, leading to a total return of 49.07%.<BR><BR>Finally, in the 5-year period, the price return was 189.62%, with a dividend return of 35.52%, resulting in a total return of 225.14%.<BR><BR>Overall, Uniphos Enterprises Ltd has shown a strong commitment to returning value to shareholders through its significant dividend declaration and has demonstrated positive total returns across all periods, particularly over the longer term.

View full answer
iScoreScore
Click here to find our call on this stock
Strong Sell
Sell
Hold
Buy
Strong Buy

Dashboard

1

With a Operating Losses, the company has a Weak Long Term Fundamental Strength

  • Company's ability to service its debt is weak with a poor EBIT to Interest (avg) ratio of -3.69
  • The company has reported losses. Due to this company has reported negative ROCE
2

Flat results in Mar 26

3

Risky - Negative EBITDA

4

Despite the size of the company, domestic mutual funds hold only 0.01% of the company

5

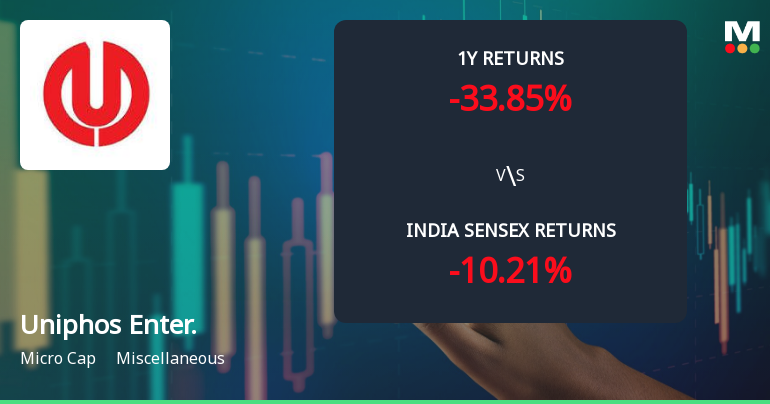
Consistent Underperformance against the benchmark over the last 3 years

stock-summaryMojo Parameters

Mojo Parameters

Loading Valuation Snapshot...

Stock DNA

stock-summary
Industry

Miscellaneous

stock-summary
Market cap

INR 722 Cr (Micro Cap)

stock-summary
P/E

34.00

stock-summary
Industry P/E

21

stock-summary
Dividend Yield

0.49%

stock-summary
Debt Equity

-0.01

stock-summary
Return on Equity

0.85%

stock-summary
Price to Book

0.29

Revenue and Profits:
Net Sales:
26 Cr
(Quarterly Results - Mar 2026)
Net Profit:
-1 Cr
stock-summaryTotal Returns
Total Returns (Price + Dividend) stock-summary
Dividend Yield (0.49%)
TimePeriod
Price Return
Dividend Return
Total Return
3 Months
2.55%
0%
2.55%
6 Months
-25.36%
0%
-25.36%
1 Year
-33.54%
0.33%
-33.21%
2 Years
-37.62%
3.65%
-33.97%
3 Years
-31.5%
7.94%
-23.56%
4 Years
-19.63%
14.80%
-4.83%
5 Years
-14.26%
16.35%
2.09%

Latest dividend: 0.5 per share ex-dividend date: Aug-29-2025

Risk Adjusted Returns v/s stock-summary
Returns Beta
Icon
Beta has not been calculated since enough price history is not available
stock-summaryNews & Corporate Actions

News

Announcements stock-summary

Announcement under Regulation 30 (LODR)-Newspaper Publication

29-May-2026 | Source : BSE

Please find attached copy of newspaper publications - An extract of Audited Financial Results for the quarter and year ended 31st March 2026.

Corporate Action-Board approves Dividend

27-May-2026 | Source : BSE

Please find attached letter dated 27th May 2026.

Board Meeting Outcome for Approval Audited Financial Results For The Quarter And Year Ended 31St March 2026 Recommendation Of Dividend On Equity Shares And Other Matter As Per Letter Dated 27Th May 2026 Attached Here With.

27-May-2026 | Source : BSE

Please find attached letter dated 27th May 2026

Corporate Actions stock-summary

stock-summary
BOARD MEETING

No Upcoming Board Meetings

stock-summary
DIVIDEND

Uniphos Enterprises Ltd has declared 25% dividend, ex-date: 29 Aug 25

stock-summary
SPLITS

No Splits history available

stock-summary
BONUS

No Bonus history available

stock-summary
RIGHTS

Uniphos Enterprises Ltd has announced 173:100 rights issue, ex-date: 18 Sep 13

stock-summaryKey Factors

Quality key factors stock-summary

Factor
Value
Sales Growth (5y)
100.21%
EBIT Growth (5y)
-10.40%
EBIT to Interest (avg)
-3.69
Debt to EBITDA (avg)
Negative Net Debt
Net Debt to Equity (avg)
-0.01
Sales to Capital Employed (avg)
0.02
Tax Ratio
0.53%
Dividend Payout Ratio
102.66%
Pledged Shares
0
Institutional Holding
15.83%
ROCE (avg)
-0.15%
ROE (avg)
1.15%

Valuation key factors

Factor
Value
P/E Ratio
34
Industry P/E
21
Price to Book Value
0.29
EV to EBIT
-157.21
EV to EBITDA
-185.87
EV to Capital Employed
0.29
EV to Sales
21.67
PEG Ratio
NA
Dividend Yield
0.49%
ROCE (Latest)
-0.18%
ROE (Latest)
0.85%

Technicals key factors

Indicator
Weekly
Monthly
MACD
Mildly Bullish
Bearish
RSI
No Signal
No Signal
Bollinger Bands
Bearish
Bearish
Moving Averages
Bearish (Daily)
KST
Mildly Bullish
Bearish
Dow Theory
Mildly Bearish
No Trend
OBV
Mildly Bullish
No Trend
stock-summary Technical Indicator Scale: Bearish, Mildly Bearish, Sideways, Mildly Bullish, Bullish  Turned 
stock-summaryShareholding
Shareholding Snapshot : Mar 2026stock-summary
Shareholding Compare (%holding) stock-summary
Majority shareholders

Promoters

Pledged Promoter Holdings

None

Mutual Funds

Held by 3 Schemes (0.0%)

FIIs

Held by 15 FIIs (15.82%)

Promoter with highest holding

Nerka Chemicals Pvt Ltd (73.28%)

Highest Public shareholder

Ares Diversified (4.56%)

Individual Investors Holdings

8.92%

stock-summaryFinancial
[
  {
    "link": "quarterly",
    "btn_text": "All Quarterly Results",
    "header": "Quarterly Results Snapshot (Standalone) - Mar'26 - QoQ",
    "rhs": [
      {
        "prefix": "Net Sales ",
        "suffix": "QoQ Growth in quarter ended Mar 2026 is 0.00% vs 0.00% in Dec 2025",
        "dir": 0
      },
      {
        "prefix": "Standalone Net Profit ",
        "suffix": "QoQ Growth in quarter ended Mar 2026 is 30.69% vs -104.36% in Dec 2025",
        "dir": 1
      }
    ],
    "table": {
      "header": [
        "Mar'26",
        "Dec'25",
        "Change(%)"
      ],
      "body": [
        {
          "field": "Net Sales",
          "val1": "26.14",
          "val2": "0.00",
          "chgp": "",
          "chgp_class": "neutral"
        },
        {
          "field": "Operating Profit (PBDIT) excl Other Income",
          "val1": "-0.83",
          "val2": "-0.97",
          "chgp": "14.43%",
          "chgp_class": "positive"
        },
        {
          "field": "Interest",
          "val1": "0.00",
          "val2": "0.00",
          "chgp": "",
          "chgp_class": "neutral"
        },
        {
          "field": "Exceptional Items",
          "val1": "0.00",
          "val2": "0.00",
          "chgp": "",
          "chgp_class": "neutral"
        },
        {
          "field": "Standalone Net Profit",
          "val1": "-0.70",
          "val2": "-1.01",
          "chgp": "30.69%",
          "chgp_class": "positive"
        },
        {
          "field": "Operating Profit Margin (Excl OI)",
          "val1": "-3.18%",
          "val2": "0.00%",
          "chgp": "-3.18%",
          "chgp_class": "negative"
        }
      ]
    }
  },
  {
    "link": "half-yearly",
    "btn_text": "All Half Yearly Results",
    "header": "Half Yearly Results Snapshot (Standalone) - Sep'25",
    "rhs": [
      {
        "prefix": "Net Sales ",
        "suffix": " Growth in half year ended Sep 2025 is -82.51% vs 0.00% in Sep 2024",
        "dir": -1
      },
      {
        "prefix": "Standalone Net Profit ",
        "suffix": " Growth in half year ended Sep 2025 is 504.31% vs -90.55% in Sep 2024",
        "dir": 1
      }
    ],
    "table": {
      "header": [
        "Sep'25",
        "Sep'24",
        "Change(%)"
      ],
      "body": [
        {
          "field": "Net Sales",
          "val1": "5.86",
          "val2": "33.51",
          "chgp": "-82.51%",
          "chgp_class": "negative"
        },
        {
          "field": "Operating Profit (PBDIT) excl Other Income",
          "val1": "-1.93",
          "val2": "-1.22",
          "chgp": "-58.20%",
          "chgp_class": "negative"
        },
        {
          "field": "Interest",
          "val1": "0.00",
          "val2": "0.14",
          "chgp": "-100.00%",
          "chgp_class": "positive"
        },
        {
          "field": "Exceptional Items",
          "val1": "0.00",
          "val2": "0.00",
          "chgp": "",
          "chgp_class": "neutral"
        },
        {
          "field": "Standalone Net Profit",
          "val1": "22.42",
          "val2": "3.71",
          "chgp": "504.31%",
          "chgp_class": "positive"
        },
        {
          "field": "Operating Profit Margin (Excl OI)",
          "val1": "-32.94%",
          "val2": "-3.64%",
          "chgp": "-29.30%",
          "chgp_class": "negative"
        }
      ]
    }
  },
  {
    "link": "nine-monthly",
    "btn_text": "All Nine Monthly Results",
    "header": "Nine Monthly Results Snapshot (Standalone) - Dec'25",
    "rhs": [
      {
        "prefix": "Net Sales ",
        "suffix": "YoY Growth in nine months ended Dec 2025 is -84.82% vs 0.00% in Dec 2024",
        "dir": -1
      },
      {
        "prefix": "Standalone Net Profit ",
        "suffix": "YoY Growth in nine months ended Dec 2025 is 1,057.30% vs -95.29% in Dec 2024",
        "dir": 1
      }
    ],
    "table": {
      "header": [
        "Dec'25",
        "Dec'24",
        "Change(%)"
      ],
      "body": [
        {
          "field": "Net Sales",
          "val1": "5.86",
          "val2": "38.61",
          "chgp": "-84.82%",
          "chgp_class": "negative"
        },
        {
          "field": "Operating Profit (PBDIT) excl Other Income",
          "val1": "-2.90",
          "val2": "-2.22",
          "chgp": "-30.63%",
          "chgp_class": "negative"
        },
        {
          "field": "Interest",
          "val1": "0.00",
          "val2": "1.31",
          "chgp": "-100.00%",
          "chgp_class": "positive"
        },
        {
          "field": "Exceptional Items",
          "val1": "0.00",
          "val2": "0.00",
          "chgp": "",
          "chgp_class": "neutral"
        },
        {
          "field": "Standalone Net Profit",
          "val1": "21.41",
          "val2": "1.85",
          "chgp": "1,057.30%",
          "chgp_class": "positive"
        },
        {
          "field": "Operating Profit Margin (Excl OI)",
          "val1": "-49.49%",
          "val2": "-5.75%",
          "chgp": "-43.74%",
          "chgp_class": "negative"
        }
      ]
    }
  },
  {
    "link": "annual",
    "btn_text": "All Annual Results",
    "header": "Annual Results Snapshot (Standalone) - Mar'26",
    "rhs": [
      {
        "prefix": "Net Sales ",
        "suffix": "YoY Growth in year ended Mar 2026 is -71.30% vs 120.16% in Mar 2025",
        "dir": -1
      },
      {
        "prefix": "Standalone Net Profit ",
        "suffix": "YoY Growth in year ended Mar 2026 is 7,296.43% vs -99.27% in Mar 2025",
        "dir": 1
      }
    ],
    "table": {
      "header": [
        "Mar'26",
        "Mar'25",
        "Change(%)"
      ],
      "body": [
        {
          "field": "Net Sales",
          "val1": "32.00",
          "val2": "111.51",
          "chgp": "-71.30%",
          "chgp_class": "negative"
        },
        {
          "field": "Operating Profit (PBDIT) excl Other Income",
          "val1": "-3.73",
          "val2": "-3.83",
          "chgp": "2.61%",
          "chgp_class": "positive"
        },
        {
          "field": "Interest",
          "val1": "0.00",
          "val2": "1.32",
          "chgp": "-100.00%",
          "chgp_class": "positive"
        },
        {
          "field": "Exceptional Items",
          "val1": "0.00",
          "val2": "0.00",
          "chgp": "",
          "chgp_class": "neutral"
        },
        {
          "field": "Standalone Net Profit",
          "val1": "20.71",
          "val2": "0.28",
          "chgp": "7,296.43%",
          "chgp_class": "positive"
        },
        {
          "field": "Operating Profit Margin (Excl OI)",
          "val1": "-11.66%",
          "val2": "-3.43%",
          "chgp": "-8.23%",
          "chgp_class": "negative"
        }
      ]
    }
  }
]

Quarterly Results Snapshot (Standalone) - Mar'26 - QoQstock-summary

Mar'26
Dec'25
Change(%)
Net Sales
26.14
0.00
Operating Profit (PBDIT) excl Other Income
-0.83
-0.97
14.43%
Interest
0.00
0.00
Exceptional Items
0.00
0.00
Standalone Net Profit
-0.70
-1.01
30.69%
Operating Profit Margin (Excl OI)
-3.18%
0.00%
-3.18%
Values in Rs Cr.
Net Sales

QoQ Growth in quarter ended Mar 2026 is 0.00% vs 0.00% in Dec 2025

Direction Arrows
Standalone Net Profit

QoQ Growth in quarter ended Mar 2026 is 30.69% vs -104.36% in Dec 2025

Half Yearly Results Snapshot (Standalone) - Sep'25stock-summary

Sep'25
Sep'24
Change(%)
Net Sales
5.86
33.51
-82.51%
Operating Profit (PBDIT) excl Other Income
-1.93
-1.22
-58.20%
Interest
0.00
0.14
-100.00%
Exceptional Items
0.00
0.00
Standalone Net Profit
22.42
3.71
504.31%
Operating Profit Margin (Excl OI)
-32.94%
-3.64%
-29.30%
Values in Rs Cr.
Direction Arrows
Net Sales

Growth in half year ended Sep 2025 is -82.51% vs 0.00% in Sep 2024

Direction Arrows
Standalone Net Profit

Growth in half year ended Sep 2025 is 504.31% vs -90.55% in Sep 2024

Nine Monthly Results Snapshot (Standalone) - Dec'25stock-summary

Dec'25
Dec'24
Change(%)
Net Sales
5.86
38.61
-84.82%
Operating Profit (PBDIT) excl Other Income
-2.90
-2.22
-30.63%
Interest
0.00
1.31
-100.00%
Exceptional Items
0.00
0.00
Standalone Net Profit
21.41
1.85
1,057.30%
Operating Profit Margin (Excl OI)
-49.49%
-5.75%
-43.74%
Values in Rs Cr.
Direction Arrows
Net Sales

YoY Growth in nine months ended Dec 2025 is -84.82% vs 0.00% in Dec 2024

Direction Arrows
Standalone Net Profit

YoY Growth in nine months ended Dec 2025 is 1,057.30% vs -95.29% in Dec 2024

Annual Results Snapshot (Standalone) - Mar'26stock-summary

Mar'26
Mar'25
Change(%)
Net Sales
32.00
111.51
-71.30%
Operating Profit (PBDIT) excl Other Income
-3.73
-3.83
2.61%
Interest
0.00
1.32
-100.00%
Exceptional Items
0.00
0.00
Standalone Net Profit
20.71
0.28
7,296.43%
Operating Profit Margin (Excl OI)
-11.66%
-3.43%
-8.23%
Values in Rs Cr.
Direction Arrows
Net Sales

YoY Growth in year ended Mar 2026 is -71.30% vs 120.16% in Mar 2025

Direction Arrows
Standalone Net Profit

YoY Growth in year ended Mar 2026 is 7,296.43% vs -99.27% in Mar 2025

stock-summaryCompany CV
About Uniphos Enterprises Ltd stock-summary
stock-summary
Uniphos Enterprises Ltd
Micro Cap
Miscellaneous
Uniphos Enterprises Limited (formerly known as United Phosphorus Limited), established in 1969 to manufacture red phosphorus, an import substitute, Erstwhile UPL later started manufacturing several speciality chemicals like compounds of phosphorus, pesticides, dyes and dye-intermediates, plasticisers and mercury salts. It has grown to become one of the biggest producers and exporters of organic and inorganic mercury compounds in India.
Company Coordinates stock-summary
Company Details
11 GIDC, Valsad Dist VAPI Gujarat : 396195
stock-summary
Tel: 91-0260-2400717
stock-summary
thackerkm@uniphos.com
Registrar Details
Link Intime India Pvt Ltd, C-13 Pannalal Silk Compound, L B S Marg, Bhandup , Mumbai