
Compare United Drilling with Similar Stocks
Dashboard
Company has a Debt to Equity ratio (avg) of 0.06 times
Poor long term growth as Operating profit has grown by an annual rate -21.46% of over the last 5 years
Positive results in Mar 26
With ROE of 6.8, it has a Fair valuation with a 1.7 Price to Book Value
Majority shareholders : Promoters
Market Beating Performance
Stock DNA
Industrial Manufacturing
INR 467 Cr (Micro Cap)
26.00
34
0.75%
0.01
6.78%
1.75
Total Returns (Price + Dividend) 
Latest dividend: 0.6 per share ex-dividend date: Feb-20-2026
Risk Adjusted Returns v/s
Returns Beta

News
United Drilling Tools Ltd is Rated Hold
United Drilling Tools Ltd is rated 'Hold' by MarketsMOJO, with this rating last updated on 11 May 2026. However, the analysis and financial metrics presented here reflect the stock's current position as of 03 June 2026, providing investors with the most up-to-date view of the company’s performance and outlook.
Read full news article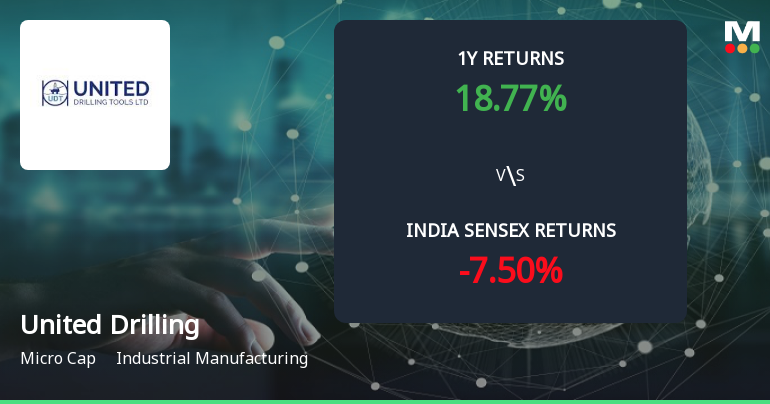
Golden Cross Forms in United Drilling Tools Ltd Amid Mixed Technical Signals
The 50-day moving average has crossed above the 200-day moving average for United Drilling Tools Ltd, signalling a golden cross on 26 May 2026. Yet, the broader technical picture is nuanced, with some indicators supporting the crossover while others suggest caution. This divergence invites a closer examination of the signal’s reliability in the context of recent price action and fundamentals.
Read full news article
United Drilling Tools Ltd is Rated Hold
United Drilling Tools Ltd is rated 'Hold' by MarketsMOJO, with this rating last updated on 11 May 2026. However, the analysis and financial metrics discussed here reflect the stock's current position as of 23 May 2026, providing investors with an up-to-date view of the company’s performance and outlook.
Read full news article Announcements
Announcement under Regulation 30 (LODR)-Press Release / Media Release
05-Jun-2026 | Source : BSEAward of Order from ShivGanga Drillers Limited
Announcement under Regulation 30 (LODR)-Award_of_Order_Receipt_of_Order
01-Jun-2026 | Source : BSEAward of order from M/s ShivGanga Drillers Limited
Compliances-Reg.24(A)-Annual Secretarial Compliance
29-May-2026 | Source : BSEAnnual Secretarial Compliance Report
Corporate Actions

No Upcoming Board Meetings

United Drilling Tools Ltd has declared 6% dividend, ex-date: 20 Feb 26

No Splits history available

United Drilling Tools Ltd has announced 1:1 bonus issue, ex-date: 10 May 18

No Rights history available
Quality key factors
Valuation key factors
Technicals key factors
 Technical Indicator Scale: Bearish, Mildly Bearish, Sideways, Mildly Bullish, Bullish Turned
 Shareholding Snapshot : Mar 2026
Shareholding Compare (%holding)
Promoters
None
Held by 0 Schemes
Held by 4 FIIs (0.44%)
Pramod Kumar Gupta (70.75%)
Cairn Oil Solutions Pvt. Ltd. (3.87%)
15.55%
Quarterly Results Snapshot (Consolidated) - Mar'26 - QoQ

QoQ Growth in quarter ended Mar 2026 is -14.27% vs -9.12% in Dec 2025
QoQ Growth in quarter ended Mar 2026 is -12.43% vs -4.87% in Dec 2025
Half Yearly Results Snapshot (Consolidated) - Sep'25
Growth in half year ended Sep 2025 is -15.49% vs 110.88% in Sep 2024
Growth in half year ended Sep 2025 is 2.71% vs 90.99% in Sep 2024
Nine Monthly Results Snapshot (Consolidated) - Dec'25
YoY Growth in nine months ended Dec 2025 is 0.47% vs 65.41% in Dec 2024
YoY Growth in nine months ended Dec 2025 is 27.40% vs 62.01% in Dec 2024
Annual Results Snapshot (Consolidated) - Mar'26
YoY Growth in year ended Mar 2026 is 7.64% vs 29.47% in Mar 2025
YoY Growth in year ended Mar 2026 is 26.21% vs 60.23% in Mar 2025
About United Drilling Tools Ltd

Company Coordinates


