
Compare Universal Auto. with Similar Stocks
Dashboard
Weak Long Term Fundamental Strength with a -158.76% CAGR growth in Operating Profits over the last 5 years
- Low ability to service debt as the company has a high Debt to EBITDA ratio of 4.00 times
- The company has been able to generate a Return on Equity (avg) of 7.42% signifying low profitability per unit of shareholders funds
Negative results in Mar 26
Risky - Negative Operating Profits
Consistent Underperformance against the benchmark over the last 3 years
Stock DNA
Auto Components & Equipments
INR 63 Cr (Micro Cap)
NA (Loss Making)
49
0.00%
0.76
-4.37%
0.83
Total Returns (Price + Dividend) 
Latest dividend: 0.5 per share ex-dividend date: Sep-30-2021
Risk Adjusted Returns v/s
Returns Beta

News

Universal Autofoundry Ltd is Rated Strong Sell
Universal Autofoundry Ltd is rated Strong Sell by MarketsMOJO. This rating was last updated on 06 August 2025. However, the analysis and financial metrics discussed below reflect the stock’s current position as of 17 June 2026, providing investors with the latest insights into the company’s performance and outlook.
Read full news article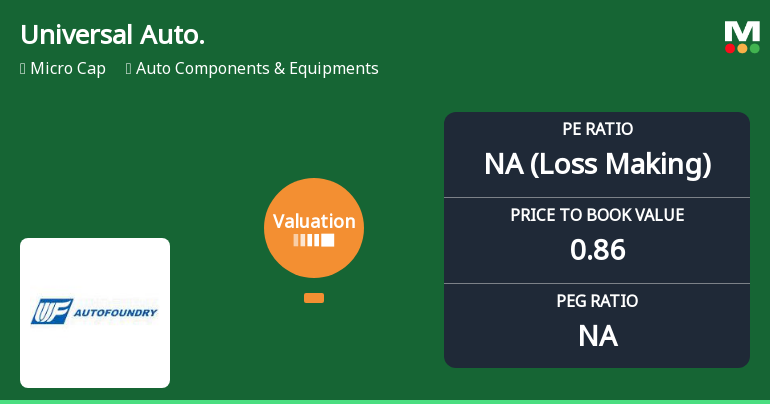
Universal Autofoundry Ltd Valuation Shifts Signal Elevated Risk Amid Market Pressure
Universal Autofoundry Ltd, a micro-cap player in the Auto Components & Equipments sector, has seen a marked deterioration in its valuation parameters, prompting a downgrade to a Strong Sell rating. Recent shifts in key metrics such as price-to-earnings (P/E) and price-to-book value (P/BV) ratios highlight a growing risk profile compared to both historical levels and peer averages.
Read full news articleAre Universal Autofoundry Ltd latest results good or bad?
Universal Autofoundry Ltd's latest financial results for Q4 FY26 reveal a complex scenario characterized by significant revenue growth juxtaposed with severe profitability challenges. The company reported a net profit of -₹1.55 crores, a stark decline from a profit of ₹2.41 crores in the same quarter last year, indicating a substantial operational setback. Despite this, revenue showed a year-on-year growth of 15.40%, reaching ₹59.44 crores, marking the highest quarterly sales in the company's recent history. However, this revenue achievement was overshadowed by a dramatic contraction in operating margins, which fell to 1.62% from 13.30% a year ago. The operating profit before depreciation, interest, tax, and other income (PBDIT excluding OI) plummeted to ₹0.96 crores from ₹6.85 crores in the previous year, reflecting a significant margin compression of 1,170 basis points. This decline in core profitability...
Read full news article Announcements
Closure of Trading Window
24-Jun-2026 | Source : BSEIntimation for Closure of Trading Window for the Quarter ended June 30 2026
Board Meeting Intimation for Intimation Of Board Meeting
23-Jun-2026 | Source : BSEUniversal Autofoundry Ltdhas informed BSE that the meeting of the Board of Directors of the Company is scheduled on 30/06/2026 inter alia to consider and approve Intimation of Board Meeting scheduled to be held on Tuesday June 30 2026
Announcement under Regulation 30 (LODR)-Investor Presentation
29-May-2026 | Source : BSEInvestor Presentation-Q4 & FY 2025-26
Corporate Actions

30 Jun 2026

Universal Autofoundry Ltd has declared 5% dividend, ex-date: 30 Sep 21

No Splits history available

Universal Autofoundry Ltd has announced 1:4 bonus issue, ex-date: 11 Nov 21

No Rights history available
Quality key factors
Valuation key factors
Technicals key factors
 Technical Indicator Scale: Bearish, Mildly Bearish, Sideways, Mildly Bullish, Bullish Turned
 Shareholding Snapshot : Mar 2026
Shareholding Compare (%holding)
Non Institution
None
Held by 0 Schemes
Held by 0 FIIs
Vimal Chand Jain (12.91%)
Dheeraj Kumar Lohia (2.61%)
44.49%
Quarterly Results Snapshot (Standalone) - Mar'26 - YoY

YoY Growth in quarter ended Mar 2026 is 15.40% vs 6.87% in Mar 2025

YoY Growth in quarter ended Mar 2026 is -164.32% vs 36.93% in Mar 2025
Half Yearly Results Snapshot (Standalone) - Sep'25
Growth in half year ended Sep 2025 is 6.39% vs -13.16% in Sep 2024
Growth in half year ended Sep 2025 is -35.00% vs -57.26% in Sep 2024
Nine Monthly Results Snapshot (Standalone) - Dec'25
YoY Growth in nine months ended Dec 2025 is 6.20% vs -8.07% in Dec 2024
YoY Growth in nine months ended Dec 2025 is -2,883.33% vs -101.92% in Dec 2024
Annual Results Snapshot (Standalone) - Mar'26
YoY Growth in year ended Mar 2026 is 8.66% vs -4.52% in Mar 2025
YoY Growth in year ended Mar 2026 is -242.13% vs -51.94% in Mar 2025
About Universal Autofoundry Ltd

Company Coordinates


