
Compare Urban Company with Similar Stocks
Dashboard
With a Operating Losses, the company has a Weak Long Term Fundamental Strength
- Company's ability to service its debt is weak with a poor EBIT to Interest (avg) ratio of -8.46
- The company has reported losses. Due to this company has reported negative ROCE
Flat results in Mar 26
Risky - Negative EBITDA
Stock DNA
Other Consumer Services
INR 20,457 Cr (Small Cap)
NA (Loss Making)
32
0.00%
-0.61
-10.95%
9.56
Total Returns (Price + Dividend) 
Urban Company for the last several years.
Risk Adjusted Returns v/s
Returns Beta

News

Urban Company Ltd is Rated Sell
Urban Company Ltd is rated 'Sell' by MarketsMOJO, with this rating last updated on 8 May 2026. However, the analysis and financial metrics discussed here reflect the stock's current position as of 14 June 2026, providing investors with an up-to-date view of the company’s fundamentals, valuation, financial trends, and technical outlook.
Read full news article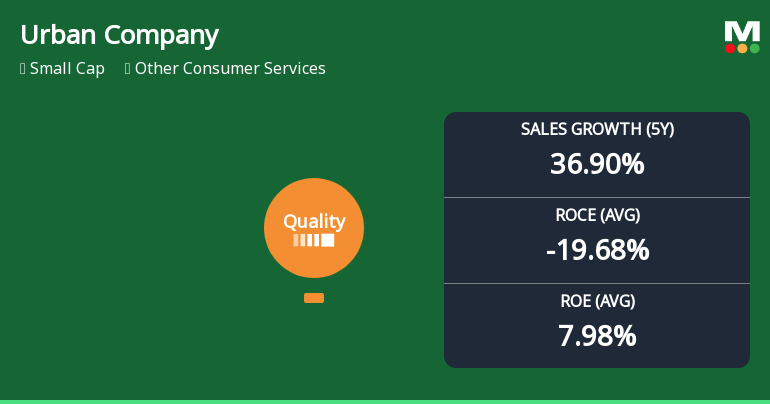
Urban Company Ltd Quality Parameters Deteriorate Amid Mixed Financial Performance
Urban Company Ltd has seen its quality grade downgraded from average to below average, reflecting a deterioration in key business fundamentals such as return on equity (ROE), return on capital employed (ROCE), and operational consistency. Despite a recent uptick in share price, the company faces significant challenges in sustaining growth and profitability amid a competitive consumer services sector.
Read full news article
Urban Company Ltd is Rated Sell
Urban Company Ltd is rated 'Sell' by MarketsMOJO, with this rating last updated on 08 May 2026. However, the analysis and financial metrics discussed here reflect the stock's current position as of 03 June 2026, providing investors with the latest insights into the company’s performance and outlook.
Read full news article Announcements
Announcement under Regulation 30 (LODR)-Newspaper Publication
06-Jun-2026 | Source : BSENewspaper Publication of 12th Annual General Meeting Notice and Annual Report for FY 25-26
Notice Of 12Th Annual General Meeting Of The Members Of The Company And Annual Report For The Financial Year 2025-26
05-Jun-2026 | Source : BSENotice of 12th Annual General Meeting of the Members of the Company and Annual Report for the Financial year 2025-26
Reg. 34 (1) Annual Report.
05-Jun-2026 | Source : BSENotice of 12th Annual General Meeting of the Members of the Company and Annual Report for the financial year 2025-26
Corporate Actions

No Upcoming Board Meetings

No Dividend history available

No Splits history available

No Bonus history available

No Rights history available
Quality key factors
Valuation key factors
Technicals key factors
 Technical Indicator Scale: Bearish, Mildly Bearish, Sideways, Mildly Bullish, Bullish Turned
 Shareholding Snapshot : Mar 2026
Shareholding Compare (%holding)
FIIs
None
Held by 16 Schemes (8.88%)
Held by 50 FIIs (55.87%)
Varun Khaitan (6.34%)
Elevation Capital V Limited (8.13%)
6.84%
Quarterly Results Snapshot (Standalone) - Mar'26 - QoQ

QoQ Growth in quarter ended Mar 2026 is 7.82% vs -3.11% in Dec 2025

QoQ Growth in quarter ended Mar 2026 is -914.59% vs 68.86% in Dec 2025
Half Yearly Results Snapshot (Consolidated) - Sep'25
Growth in half year ended Sep 2025 is 103.47% vs -34.19% in Mar 2025
Growth in half year ended Sep 2025 is -854.90% vs -35.50% in Mar 2025
Nine Monthly Results Snapshot (Standalone) - Dec'25
Not Applicable: The company has declared_date for only one period
Not Applicable: The company has declared_date for only one period
Annual Results Snapshot (Standalone) - Mar'26
YoY Growth in year ended Mar 2026 is 38.16% vs 36.87% in Mar 2025
YoY Growth in year ended Mar 2026 is -167.36% vs 2,691.78% in Mar 2025
About Urban Company Ltd

Company Coordinates


