
Compare Uttam Sug.Mills with Similar Stocks
Dashboard
Weak Long Term Fundamental Strength with a -1.36% CAGR growth in Operating Profits over the last 5 years
- Low ability to service debt as the company has a high Debt to EBITDA ratio of 3.08 times
- NET SALES(Q) At Rs 470.10 cr has Fallen at -17.06%
- INTEREST(Q) At Rs 13.01 cr has Grown at 107.17%
- PBT LESS OI(Q) At Rs 73.13 cr has Fallen at -14.32%
Despite the size of the company, domestic mutual funds hold only 0% of the company
Consistent Underperformance against the benchmark over the last 3 years
Total Returns (Price + Dividend) 
Latest dividend: 2.5 per share ex-dividend date: Sep-12-2025
Risk Adjusted Returns v/s
Returns Beta

News

Uttam Sugar Mills Ltd is Rated Sell
Uttam Sugar Mills Ltd is rated 'Sell' by MarketsMOJO, with this rating last updated on 26 May 2026. However, the analysis and financial metrics discussed here reflect the stock's current position as of 20 June 2026, providing investors with an up-to-date perspective on the company’s fundamentals, valuation, financial trends, and technical outlook.
Read full news article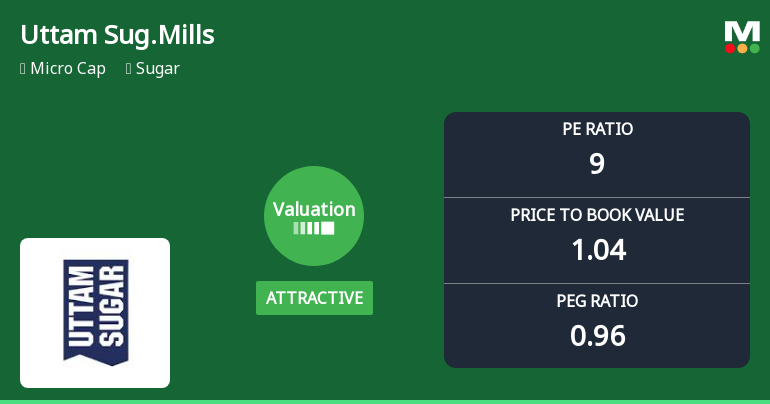
Uttam Sugar Mills Ltd Valuation Shifts Signal Renewed Price Attractiveness
Uttam Sugar Mills Ltd has witnessed a notable shift in its valuation parameters, moving from a fair to an attractive rating, despite ongoing sector headwinds and a micro-cap market capitalisation. This change reflects improved price metrics relative to historical averages and peer comparisons, offering investors a fresh perspective on the stock’s price attractiveness.
Read full news article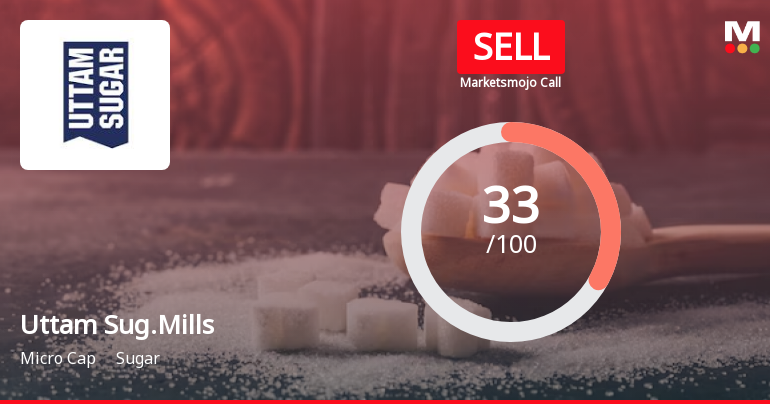
Uttam Sugar Mills Ltd is Rated Sell
Uttam Sugar Mills Ltd is rated Sell by MarketsMOJO, with this rating last updated on 26 May 2026. However, the analysis and financial metrics discussed here reflect the stock’s current position as of 09 June 2026, providing investors with the latest insights into the company’s performance and outlook.
Read full news article Announcements
Announcement under Regulation 30 (LODR)-Credit Rating
10-Jun-2026 | Source : BSEIndia Ratings and Research Private Limited has upgraded the ratings for various credit facilities availed by the Company. We are submitting herewith the same.
Compliances-Reg.24(A)-Annual Secretarial Compliance
28-May-2026 | Source : BSEWe are submitting herewith Annual Secretarial Compliance report for the Financial year ended 31st March 2026
Result Presentation In Respect Of The Audited Financial Results For The Quarter /Year Ended On 31.03.2026
16-May-2026 | Source : BSEWe are submitting herewith Results Presentation in respect of Audited Financial Results for the quarter/year ended on 31.03.2026.
Corporate Actions

No Upcoming Board Meetings

Uttam Sugar Mills Ltd has declared 25% dividend, ex-date: 12 Sep 25

No Splits history available

No Bonus history available

Uttam Sugar Mills Ltd has announced 12:25 rights issue, ex-date: 05 Sep 12
Quality key factors
Valuation key factors
Technicals key factors
 Technical Indicator Scale: Bearish, Mildly Bearish, Sideways, Mildly Bullish, Bullish Turned
 Shareholding Snapshot : Mar 2026
Shareholding Compare (%holding)
Promoters
None
Held by 0 Schemes
Held by 6 FIIs (0.26%)
Uttam Adlakha & Sons Holdings Private Limited (42.74%)
Anil Kumar Goel (3.67%)
22.46%
Quarterly Results Snapshot (Consolidated) - Mar'26 - YoY

YoY Growth in quarter ended Mar 2026 is -17.06% vs 21.85% in Mar 2025
YoY Growth in quarter ended Mar 2026 is -16.84% vs 56.26% in Mar 2025
Half Yearly Results Snapshot (Consolidated) - Sep'25

Growth in half year ended Sep 2025 is 41.63% vs -19.69% in Sep 2024
Growth in half year ended Sep 2025 is 278.33% vs -118.71% in Sep 2024
Nine Monthly Results Snapshot (Consolidated) - Dec'25
YoY Growth in nine months ended Dec 2025 is 35.36% vs -19.13% in Dec 2024
YoY Growth in nine months ended Dec 2025 is 102.54% vs -75.04% in Dec 2024
Annual Results Snapshot (Consolidated) - Mar'26
YoY Growth in year ended Mar 2026 is 19.27% vs -9.82% in Mar 2025
YoY Growth in year ended Mar 2026 is 13.57% vs -33.20% in Mar 2025
About Uttam Sugar Mills Ltd

Company Coordinates


