
Compare V-Guard Industri with Similar Stocks
Dashboard
Company has a Debt to Equity ratio (avg) of 0.10 times
Poor long term growth as Operating profit has grown by an annual rate 8.90% of over the last 5 years
Positive results in Mar 26
With ROE of 13.7, it has a Attractive valuation with a 5.7 Price to Book Value
High Institutional Holdings at 35.46%
Below par performance in long term as well as near term
Stock DNA
Electronics & Appliances
INR 13,555 Cr (Small Cap)
42.00
48
0.48%
-0.03
13.68%
5.73
Total Returns (Price + Dividend) 
Latest dividend: 1.5 per share ex-dividend date: Jul-31-2025
Risk Adjusted Returns v/s
Returns Beta

News

V-Guard Industries Ltd is Rated Hold
V-Guard Industries Ltd is rated 'Hold' by MarketsMOJO, with this rating last updated on 13 May 2026. However, the analysis and financial metrics presented here reflect the stock's current position as of 19 June 2026, providing investors with an up-to-date view of the company’s fundamentals, returns, and market standing.
Read full news article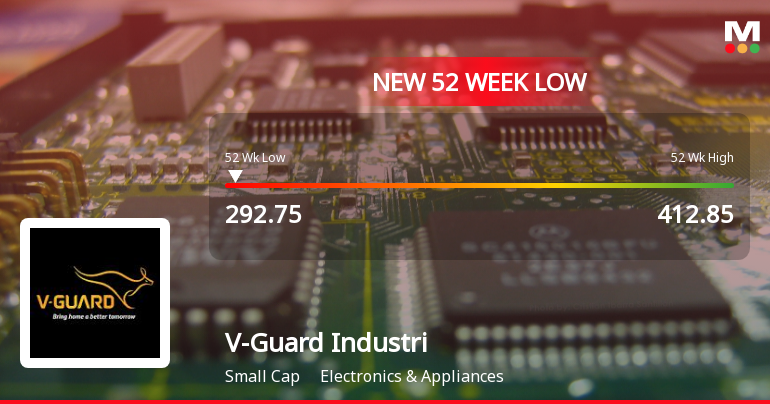

V-Guard Industries Ltd is Rated Hold
V-Guard Industries Ltd is rated 'Hold' by MarketsMOJO, with this rating last updated on 13 May 2026. However, the analysis and financial metrics discussed here reflect the stock's current position as of 08 June 2026, providing investors with an up-to-date view of the company's performance and prospects.
Read full news article Announcements
Announcement under Regulation 30 (LODR)-Analyst / Investor Meet - Intimation
12-Jun-2026 | Source : BSEIntimation of analyst/investor meet
Compliances-Reg.24(A)-Annual Secretarial Compliance
22-May-2026 | Source : BSEAnnual Secretarial compliance Report for the year ended March 31 2026.
Announcement under Regulation 30 (LODR)-Newspaper Publication
20-May-2026 | Source : BSEKindly find attached Newspaper publication regarding transfer of equity shares to IEPFA
Corporate Actions

No Upcoming Board Meetings

V-Guard Industries Ltd has declared 150% dividend, ex-date: 31 Jul 26

V-Guard Industries Ltd has announced 1:10 stock split, ex-date: 30 Aug 16

V-Guard Industries Ltd has announced 2:5 bonus issue, ex-date: 15 Mar 17

No Rights history available
Quality key factors
Valuation key factors
Technicals key factors
 Technical Indicator Scale: Bearish, Mildly Bearish, Sideways, Mildly Bullish, Bullish Turned
 Shareholding Snapshot : Mar 2026
Shareholding Compare (%holding)
Promoters
None
Held by 15 Schemes (23.35%)
Held by 121 FIIs (12.07%)
Mithun Kochouseph Chittilappilly (19.8%)
Sbi Small Cap Fund (7.36%)
9.45%
Quarterly Results Snapshot (Consolidated) - Mar'26 - QoQ

QoQ Growth in quarter ended Mar 2026 is 25.06% vs 4.67% in Dec 2025
QoQ Growth in quarter ended Mar 2026 is 96.51% vs -12.61% in Dec 2025
Half Yearly Results Snapshot (Consolidated) - Sep'25

Growth in half year ended Sep 2025 is 1.30% vs 17.99% in Sep 2024
Growth in half year ended Sep 2025 is -14.30% vs 31.82% in Sep 2024
Nine Monthly Results Snapshot (Consolidated) - Dec'25
YoY Growth in nine months ended Dec 2025 is 4.23% vs 14.96% in Dec 2024
YoY Growth in nine months ended Dec 2025 is -11.85% vs 22.69% in Dec 2024
Annual Results Snapshot (Consolidated) - Mar'26
YoY Growth in year ended Mar 2026 is 6.96% vs 14.85% in Mar 2025
YoY Growth in year ended Mar 2026 is -1.72% vs 21.80% in Mar 2025
About V-Guard Industries Ltd

Company Coordinates


