Vadilal Inds.

INR
7,588.50
150 (2.02%)
BSENSE

Sep 22, 09:41 AM

BSE+NSE Vol: 3.0 k

  • Price Points
  • Score
  • Mojo Parameters
  • Total Return
  • News and Corporate Actions
  • Key factors
  • Shareholding
  • Financials
  • CompanyCV
stock-summaryPrice Point
High/Low

1Day

52 Week

Valuation
Technical
Day's Volume

CASH

3.0 k (-8.43%) Volume

Shareholding (Jun 2026)

FII

1.02%

Held by 37 FIIs

DII

1.26%

Held by 0 DIIs

Promoter

64.73%

Why is Vadilal Industries Ltd falling/rising?

06-Sep-2026

As of 05-Sep, Vadilal Industries Ltd's stock price is rising due to strong financial health, impressive profit growth, and increased institutional investor participation, despite a recent decline in delivery volume. The company's low Debt to EBITDA ratio and favorable PEG ratio further support its upward trajectory.

As of 05-Sep, Vadilal Industries Ltd's stock price is rising, currently at 7,657.60, with a change of 33.35 (0.44%) upward. This increase can be attributed to several positive factors surrounding the company's performance and market sentiment. <BR><BR>The company has demonstrated strong financial health, evidenced by a low Debt to EBITDA ratio of 0.93 times, indicating a strong ability to service its debt. Furthermore, Vadilal Industries has reported impressive growth in its operating profit, which has increased at an annual rate of 41.95%. The net profit has surged by 95.45%, and the company has declared outstanding results in its last two consecutive quarters, with a PAT of Rs 130.91 crore reflecting a growth of 95.4%. <BR><BR>Additionally, the stock has shown consistent returns, generating a remarkable 52.79% return over the past year, while its profits have risen by 56.6%. The PEG ratio of the company stands at 0.4, suggesting that the stock is trading at a discount compared to its peers' average historical valuations. <BR><BR>Moreover, there is an increasing participation by institutional investors, who have raised their stake by 1.28% over the previous quarter, indicating confidence in the company's fundamentals. This institutional backing often leads to enhanced market credibility and can positively influence stock price movements.<BR><BR>Despite a recent decline in investor participation, with delivery volume falling by 53.89% against the 5-day average, the overall positive financial indicators and institutional interest contribute to the stock's upward trajectory. Thus, the combination of strong financial performance, attractive valuations, and institutional support is driving the rise in Vadilal Industries Ltd's stock price.

View full answer

Who are in the management team of Vadilal Inds.?

01-Sep-2026

The management team of Vadilal Industries includes Preet P Shah (Chairman & Independent Director), Rajesh R Gandhi (Executive Director/Managing Director/Promoter), Devanshu L Gandhi (Executive Director/Managing Director/Promoter), Deval D Gandhi (Non-Executive & Non-Independent Director), Kalpit R Gandhi (Non-Executive & Non-Independent Director), and Shaily Dedhia (Independent Director). They are responsible for the company's strategic direction and operations.

The management team of Vadilal Industries includes the following individuals:<BR><BR>1. **Preet P Shah** - Chairman & Independent Director<BR>2. **Rajesh R Gandhi** - Executive Director / Managing Director / Promoter<BR>3. **Devanshu L Gandhi** - Executive Director / Managing Director / Promoter<BR>4. **Deval D Gandhi** - Non-Executive & Non-Independent Director<BR>5. **Kalpit R Gandhi** - Non-Executive & Non-Independent Director<BR>6. **Shaily Dedhia** - Independent Director<BR><BR>This team plays a crucial role in guiding the company's strategic direction and operations.

View full answer

What does Vadilal Inds. do?

01-Sep-2026

Vadilal Industries Ltd is a small-cap FMCG company primarily engaged in manufacturing ice creams and ice-cream candies. As of June 2026, it reported net sales of ₹680 Cr and a net profit of ₹131 Cr.

Overview:<BR>Vadilal Industries Ltd operates in the FMCG sector, primarily focusing on the manufacturing of ice creams and ice-cream candies, and is categorized as a small-cap company.<BR><BR>History:<BR>Vadilal Industries Ltd was originally incorporated as Vadilal Oxygen Pvt Ltd in April 1982. The company underwent a significant change when Vadilal Ice-cream Pvt Ltd, which was established in June 1981, amalgamated with Vadilal Oxygen in July 1985. The company's name was subsequently changed to Vadilal Industries Limited. The latest quarterly results reported net sales and net profit for June 2026.<BR><BR>Financial Snapshot:<BR>- Net Sales: 680 Cr (Quarterly Results - Jun 2026)<BR>- Net Profit: 131 Cr (Quarterly Results - Jun 2026)<BR>- Market Cap: INR 5,568 Cr (Small Cap)<BR><BR>Key Metrics:<BR>- P/E: 25.00<BR>- Industry P/E: 44<BR>- Dividend Yield: 0.48%<BR>- Debt Equity: 0.20<BR>- Return on Equity: 18.24%<BR>- Price to Book: 6.64<BR><BR>Contact Details:<BR>Address: Vadilal House Shrimali Society, Navrangpura Ahmedabad Gujarat : 380009<BR>Tel: 91-079-26564019-24/30153347<BR>Email: shareslogs@vadilalgroup.com<BR>Website: http://www.vadilalgroup.com

View full answer

Who are the peers of the Vadilal Inds.?

01-Sep-2026

Vadilal Inds. peers include Hindustan Foods, Jyothy Labs, Mrs Bectors, Dodla Dairy, Bajaj Consumer, VST Industries, Gopal Snacks, Heritage Foods, Parag Milk Foods, and ADF Foods. Vadilal Inds. has average management risk and excellent growth, with a 1-year return of 50.78%, while Bajaj Consumer leads with a 102.26% return.

Peers: The peers of Vadilal Inds. are Hindustan Foods, Jyothy Labs, Mrs Bectors, Dodla Dairy, Bajaj Consumer, VST Industries, Gopal Snacks, Heritage Foods, Parag Milk Foods, and ADF Foods.<BR><BR>Quality Snapshot: Excellent management risk is observed at Jyothy Labs, Mrs Bectors, Dodla Dairy, Bajaj Consumer, and VST Industries, while Good management risk is found at Hindustan Foods, Gopal Snacks, and the rest. Average management risk is noted at Vadilal Inds., Heritage Foods, and Parag Milk Foods. Growth is Excellent for Vadilal Inds., while Good growth is seen at Hindustan Foods, and the rest show Below Average growth. Capital Structure is Excellent for Jyothy Labs, Mrs Bectors, Dodla Dairy, Bajaj Consumer, VST Industries, Gopal Snacks, and ADF Foods, while Vadilal Inds. and Heritage Foods have an Excellent Capital Structure, and Parag Milk Foods has a Below Average Capital Structure.<BR><BR>Return Snapshot: The peer with the highest 1-year return is Bajaj Consumer at 102.26%, while Jyothy Labs has the lowest at -40.09%. Vadilal Inds. has a 1-year return of 50.78%, which is significantly higher than Jyothy Labs but lower than Bajaj Consumer. Additionally, the peers with negative six-month returns include Jyothy Labs, Dodla Dairy, VST Industries, Gopal Snacks, and Heritage Foods.

View full answer

How big is Vadilal Inds.?

01-Sep-2026

As of 31st August, Vadilal Industries Ltd has a market capitalization of 5,568.00 Cr, with recent net sales of 1,675.87 Cr and a net profit of 219.03 Cr.

As of 31st August, Vadilal Industries Ltd has a market capitalization of 5,568.00 Cr, categorizing it as a Small Cap company.<BR><BR>In the latest four quarters, Vadilal Industries Ltd reported Net Sales of 1,675.87 Cr and a Net Profit of 219.03 Cr.<BR><BR>The latest annual period for the balance sheet is March 2026, with Shareholder's Funds amounting to 850.31 Cr and Total Assets of 1,268.36 Cr.

View full answer

Should I buy, sell or hold Vadilal Industries Ltd?

14-Aug-2026

Has Vadilal Industries Ltd declared dividend?

14-Aug-2026

Yes, Vadilal Industries Ltd has declared a dividend of 170%, amounting to ₹21 per share, with an ex-date of August 21, 2026. The company has shown strong total returns across various periods, with a 5-year total return of 558.5%.

Vadilal Industries Ltd has declared a dividend.<BR><BR>Dividend Details:<BR>- Percentage announced: 170%<BR>- Amount per share: 21<BR>- Ex-date: 21 Aug 26<BR><BR>Dividend Yield: 0.27%<BR><BR>Total Returns by Period:<BR>In the last 3 months, the price return was 81.56%, the dividend return was 0.41%, resulting in a total return of 81.97%.<BR><BR>Over the past 6 months, the price return stood at 49.68%, with a dividend return of 0.33%, leading to a total return of 50.01%.<BR><BR>For the 1-year period, the price return was 58.12%, the dividend return was 0.78%, culminating in a total return of 58.9%.<BR><BR>In the 2-year span, the price return reached 91.74%, with a dividend return of 0.99%, resulting in a total return of 92.73%.<BR><BR>During the last 3 years, the price return was 176.11%, the dividend return was 1.53%, giving a total return of 177.64%.<BR><BR>Over the 4-year period, the price return was 233.12%, the dividend return was 1.61%, leading to a total return of 234.73%.<BR><BR>In the last 5 years, the price return was 554.59%, with a dividend return of 3.91%, resulting in a total return of 558.5%.<BR><BR>Overall, Vadilal Industries Ltd has declared a significant dividend and demonstrated strong total returns across multiple periods, indicating a positive performance for shareholders.

View full answer

Are Vadilal Industries Ltd latest results good or bad?

28-May-2026

Vadilal Industries Ltd's latest Q4 FY26 results are strong, with a net profit of ₹54.86 crore (up 149.36% year-on-year) and revenue of ₹415.83 crore (up 51.21%). The company shows effective cost management and operational efficiency, although it may face seasonal performance volatility.

Vadilal Industries Ltd's latest results for Q4 FY26 are quite impressive. The company reported a net profit of ₹54.86 crore, which marks a significant year-on-year increase of 149.36%. Additionally, revenue surged to ₹415.83 crore, reflecting a robust growth of 51.21% compared to the same quarter last year. <BR><BR>The operating margin also improved to 20.46%, the highest in four quarters, demonstrating effective cost management and operational efficiency. Furthermore, the return on equity stands strong at 21.17%, indicating effective capital utilization.<BR><BR>Overall, these results suggest that Vadilal Industries is performing well, particularly capitalizing on the peak season for ice cream consumption in India. However, it's important to note that the company faces challenges related to seasonality, which can lead to volatility in performance during off-peak months. Despite this, the current financial metrics indicate a positive trajectory for the company.

View full answer

When is the next results date for Vadilal Industries Ltd?

22-May-2026

The next results date for Vadilal Industries Ltd is 27 May 2026.

The next results date for Vadilal Industries Ltd is scheduled for 27 May 2026.

View full answer

Is Vadilal Inds. overvalued or undervalued?

04-Dec-2025

As of December 3, 2025, Vadilal Industries is considered fairly valued with a PE ratio of 28.81, outperforming the Sensex with a 41.58% return over the past year, and is viewed as attractive compared to peers like Hindustan Unilever and Nestle India, which have much higher valuations.

As of 3 December 2025, the valuation grade for Vadilal Industries has moved from very attractive to attractive, indicating a shift in perception regarding its market value. The company is currently assessed as fairly valued. Key ratios include a PE ratio of 28.81, an EV to EBITDA of 18.26, and a ROCE of 20.29%. <BR><BR>In comparison to its peers, Vadilal Industries stands out with a lower PE ratio than Hindustan Unilever at 54.52 and Nestle India at 79.74, both of which are considered very expensive. Despite being attractive, Vadilal's valuation reflects a premium in the FMCG sector, especially when compared to peers like Pidilite Industries and Britannia Industries, which also exhibit high valuations. The company's stock has outperformed the Sensex significantly over the past year, with a return of 41.58% compared to the Sensex's 5.27%, reinforcing its strong market position.

View full answer

Is Vadilal Inds. technically bullish or bearish?

28-Nov-2025

As of November 27, 2025, the market trend is mildly bullish, supported by daily moving averages and positive OBV, though mixed signals from the MACD and KST indicate some caution.

As of 27 November 2025, the technical trend has changed from bullish to mildly bullish. The current stance is mildly bullish, driven by the daily moving averages and the overall performance in the longer-term time frames. The weekly MACD indicates a mildly bearish signal, while the monthly MACD remains bullish. Bollinger Bands are bullish on both weekly and monthly charts, supporting the upward price movement. The KST shows a bullish weekly trend but is mildly bearish monthly, indicating mixed signals. The Dow Theory shows no trend on the weekly but is mildly bullish monthly. The On-Balance Volume (OBV) is mildly bullish across both time frames, suggesting positive accumulation. Overall, the strength of the bullish stance is tempered by the mixed signals from MACD and KST.

View full answer

How has been the historical performance of Vadilal Inds.?

13-Nov-2025

Vadilal Industries has shown consistent growth, with net sales increasing from 463.79 crore in March 2021 to 1,238.08 crore in March 2025, and profit after tax rising from 4.63 crore to 150.33 crore in the same period. Despite challenges in cash management, the company has improved operational efficiency and significantly expanded its asset base.

Answer:<BR>The historical performance of Vadilal Industries shows a consistent growth trajectory in net sales and profitability over the years.<BR><BR>Breakdown:<BR>Vadilal Industries has demonstrated significant growth in net sales, increasing from 463.79 crore in March 2021 to 1,238.08 crore in March 2025. This upward trend is mirrored in total operating income, which rose from 463.79 crore in March 2021 to 1,238.08 crore in March 2025. The company's operating profit (PBDIT) also saw a substantial increase, climbing from 51.97 crore in March 2021 to 255.57 crore in March 2025, indicating improved operational efficiency. Profit before tax followed a similar pattern, growing from 7.68 crore in March 2021 to 199.69 crore in March 2025, while profit after tax reached 150.33 crore in March 2025, up from just 4.63 crore in March 2021. The company's total assets increased significantly from 573.97 crore in March 2020 to 1,094.32 crore in March 2025, reflecting a strong asset base. Total liabilities also rose, but at a slower pace, from 567.49 crore in March 2021 to 1,094.32 crore in March 2025. Cash flow from operating activities peaked at 130 crore in March 2025, although the net cash outflow was recorded at -7 crore for the same period, indicating some challenges in cash management despite overall profitability.

View full answer

Who are the top shareholders of the Vadilal Inds.?

17-Jul-2025

The top shareholders of Vadilal Industries include Vadilal International Pvt Ltd with 39.09%, followed by individual investors at 20.8%, and Nirankar Advisor LLP as the highest public shareholder at 1.14%. Additionally, 33 Foreign Institutional Investors hold 0.68% of the shares, with a pledged promoter holding of 7.57%.

The top shareholders of Vadilal Industries include the promoters, with Vadilal International Pvt Ltd holding the largest stake at 39.09%. Additionally, there are 33 Foreign Institutional Investors (FIIs) who collectively hold 0.68% of the shares. The highest public shareholder is Nirankar Advisor LLP, which holds 1.14%. Individual investors account for 20.8% of the shareholding. It's worth noting that there is a pledged promoter holding of 7.5654%.

View full answer
iScoreScore
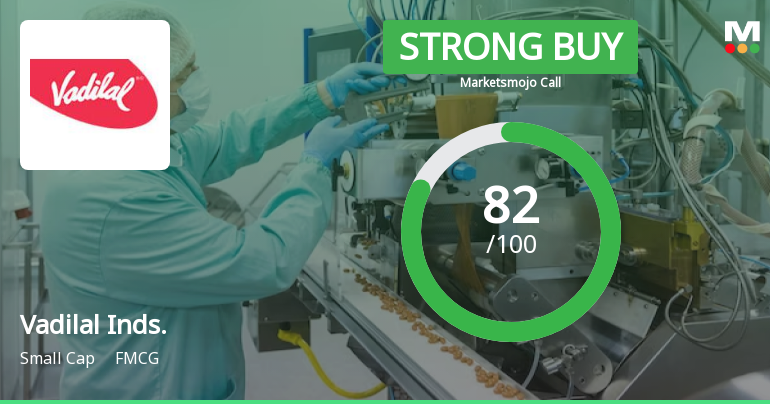
Click here to find our call on this stock
Strong Sell
Sell
Hold
Buy
Strong Buy

Dashboard

1

Strong ability to service debt as the company has a low Debt to EBITDA ratio of 0.93 times

 
2

Healthy long term growth as Operating profit has grown by an annual rate 41.95%

 
3

With a growth in Net Profit of 95.45%, the company declared Outstanding results in Jun 26

4

With ROCE of 19.5, it has a Attractive valuation with a 5.4 Enterprise value to Capital Employed

5

Increasing Participation by Institutional Investors

stock-summaryMojo Parameters

Mojo Parameters

Loading Valuation Snapshot...

Stock DNA

stock-summary
Industry

FMCG

stock-summary
Market cap

INR 5,454 Cr (Small Cap)

stock-summary
P/E

24.00

stock-summary
Industry P/E

43

stock-summary
Dividend Yield

0.81%

stock-summary
Debt Equity

0.20

stock-summary
Return on Equity

18.24%

stock-summary
Price to Book

6.24

Revenue and Profits:
Net Sales:
680 Cr
(Quarterly Results - Jun 2026)
Net Profit:
131 Cr
stock-summaryTotal Returns
Total Returns (Price + Dividend) stock-summary
Dividend Yield (0.81%)
TimePeriod
Price Return
Dividend Return
Total Return
3 Months
19.34%
0.94%
20.28%
6 Months
67.36%
1.40%
68.76%
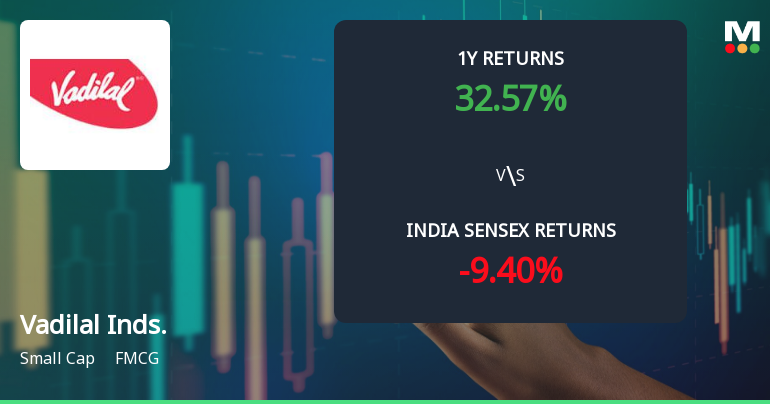
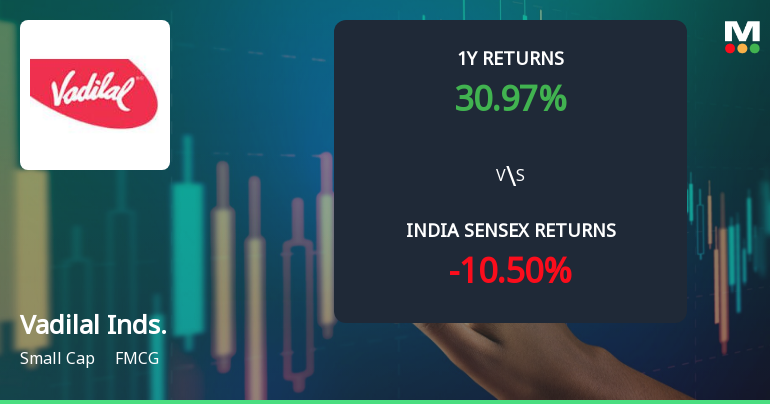
1 Year
28.65%
1.13%
29.78%
2 Years
77.95%
2.07%
80.02%
3 Years
206.56%
3.34%
209.9%
4 Years
201.75%
3.36%
205.11%
5 Years
626.14%
7.60%
633.74%

Latest dividend: 43.107709198969125 per share ex-dividend date: Sep-03-2026

Risk Adjusted Returns v/s stock-summary
Returns Beta
Icon
Beta has not been calculated since enough price history is not available
stock-summaryNews & Corporate Actions

Announcements stock-summary

Shareholder Meeting / Postal Ballot-Scrutinizers Report

11-Sep-2026 | Source : BSE

VOTING RESULTS FOR REMOTE E-VOTING AND E-VOTING DURING THE AGM ALONG WITH THE SCRUTINIZERS REPORT OF 42nd ANNUAL GENERAL MEETING AND DETAILS THEREOF.

Announcement Under Regulation 30 Of SEBI LODR

11-Sep-2026 | Source : BSE

Disclosure pursuant to Regulation 30 of the SEBI (Listing Obligations and Disclosure Requirements) Regulations 2015 (LODR Regulations).

Shareholder Meeting / Postal Ballot-Outcome of AGM

10-Sep-2026 | Source : BSE

Gist of Proceedings of 42nd Annual General Meeting of Vadilal Industries Limited held on 10th September 2026

Corporate Actions stock-summary

stock-summary
BOARD MEETING

No Upcoming Board Meetings

stock-summary
DIVIDEND

Vadilal Industries Ltd has declared 430% dividend, ex-date: 03 Sep 26

stock-summary
SPLITS

No Splits history available

stock-summary
BONUS

No Bonus history available

stock-summary
RIGHTS

No Rights history available

stock-summaryKey Factors

Quality key factors stock-summary

Factor
Value
Sales Growth (5y)
24.65%
EBIT Growth (5y)
41.95%
EBIT to Interest (avg)
11.28
Debt to EBITDA (avg)
1.13
Net Debt to Equity (avg)
0.20
Sales to Capital Employed (avg)
1.51
Tax Ratio
24.53%
Dividend Payout Ratio
19.93%
Pledged Shares
7.52%
Institutional Holding
2.28%
ROCE (avg)
23.77%
ROE (avg)
21.21%

Valuation key factors

Factor
Value
P/E Ratio
24
Industry P/E
43
Price to Book Value
6.24
EV to EBIT
20.96
EV to EBITDA
17.45
EV to Capital Employed
5.36
EV to Sales
3.27
PEG Ratio
0.43
Dividend Yield
0.81%
ROCE (Latest)
19.50%
ROE (Latest)
18.24%

Technicals key factors

Indicator
Weekly
Monthly
MACD
Mildly Bearish
Bullish
RSI
No Signal
No Signal
Bollinger Bands
Bullish
Mildly Bullish
Moving Averages
Bullish (Daily)
KST
Bullish
Mildly Bearish
Dow Theory
Mildly Bearish
Bullish
OBV
No Trend
No Trend
stock-summary Technical Indicator Scale: Bearish, Mildly Bearish, Sideways, Mildly Bullish, Bullish  Turned 
stock-summaryShareholding
Shareholding Snapshot : Jun 2026stock-summary
Shareholding Compare (%holding) stock-summary
Majority shareholders

Promoters

Pledged Promoter Holdings

7.5225

Mutual Funds

Held by 1 Schemes (0.0%)

FIIs

Held by 37 FIIs (1.02%)

Promoter with highest holding

Vadilal International Pvt Ltd (39.09%)

Highest Public shareholder

Kifs Trade Capital Private Limited (1.14%)

Individual Investors Holdings

18.56%

stock-summaryFinancial
[
  {
    "link": "quarterly",
    "btn_text": "All Quarterly Results",
    "header": "Quarterly Results Snapshot (Consolidated) - Jun'26 - YoY",
    "rhs": [
      {
        "prefix": "Net Sales ",
        "suffix": "YoY Growth in quarter ended Jun 2026 is 34.24% vs 9.12% in Jun 2025",
        "dir": 1
      },
      {
        "prefix": "Consolidated Net Profit ",
        "suffix": "YoY Growth in quarter ended Jun 2026 is 95.45% vs -13.48% in Jun 2025",
        "dir": 1
      }
    ],
    "table": {
      "header": [
        "Jun'26",
        "Jun'25",
        "Change(%)"
      ],
      "body": [
        {
          "field": "Net Sales",
          "val1": "680.06",
          "val2": "506.59",
          "chgp": "34.24%",
          "chgp_class": "positive"
        },
        {
          "field": "Operating Profit (PBDIT) excl Other Income",
          "val1": "166.18",
          "val2": "100.44",
          "chgp": "65.45%",
          "chgp_class": "positive"
        },
        {
          "field": "Interest",
          "val1": "4.44",
          "val2": "3.83",
          "chgp": "15.93%",
          "chgp_class": "negative"
        },
        {
          "field": "Exceptional Items",
          "val1": "0.00",
          "val2": "0.00",
          "chgp": "",
          "chgp_class": "neutral"
        },
        {
          "field": "Consolidate Net Profit",
          "val1": "130.91",
          "val2": "66.98",
          "chgp": "95.45%",
          "chgp_class": "positive"
        },
        {
          "field": "Operating Profit Margin (Excl OI)",
          "val1": "24.44%",
          "val2": "19.83%",
          "chgp": "4.61%",
          "chgp_class": "positive"
        }
      ]
    }
  },
  {
    "link": "half-yearly",
    "btn_text": "All Half Yearly Results",
    "header": "Half Yearly Results Snapshot (Consolidated) - Sep'25",
    "rhs": [
      {
        "prefix": "Net Sales ",
        "suffix": " Growth in half year ended Sep 2025 is 11.51% vs 8.60% in Sep 2024",
        "dir": 1
      },
      {
        "prefix": "Consolidated Net Profit ",
        "suffix": " Growth in half year ended Sep 2025 is -13.75% vs 6.72% in Sep 2024",
        "dir": -1
      }
    ],
    "table": {
      "header": [
        "Sep'25",
        "Sep'24",
        "Change(%)"
      ],
      "body": [
        {
          "field": "Net Sales",
          "val1": "847.21",
          "val2": "759.76",
          "chgp": "11.51%",
          "chgp_class": "positive"
        },
        {
          "field": "Operating Profit (PBDIT) excl Other Income",
          "val1": "151.03",
          "val2": "173.94",
          "chgp": "-13.17%",
          "chgp_class": "negative"
        },
        {
          "field": "Interest",
          "val1": "7.69",
          "val2": "6.70",
          "chgp": "14.78%",
          "chgp_class": "negative"
        },
        {
          "field": "Exceptional Items",
          "val1": "0.00",
          "val2": "0.00",
          "chgp": "",
          "chgp_class": "neutral"
        },
        {
          "field": "Consolidate Net Profit",
          "val1": "100.40",
          "val2": "116.40",
          "chgp": "-13.75%",
          "chgp_class": "negative"
        },
        {
          "field": "Operating Profit Margin (Excl OI)",
          "val1": "17.83%",
          "val2": "22.89%",
          "chgp": "-5.06%",
          "chgp_class": "negative"
        }
      ]
    }
  },
  {
    "link": "nine-monthly",
    "btn_text": "All Nine Monthly Results",
    "header": "Nine Monthly Results Snapshot (Consolidated) - Dec'25",
    "rhs": [
      {
        "prefix": "Net Sales ",
        "suffix": "YoY Growth in nine months ended Dec 2025 is 12.69% vs 10.27% in Dec 2024",
        "dir": 1
      },
      {
        "prefix": "Consolidated Net Profit ",
        "suffix": "YoY Growth in nine months ended Dec 2025 is -21.89% vs 8.47% in Dec 2024",
        "dir": -1
      }
    ],
    "table": {
      "header": [
        "Dec'25",
        "Dec'24",
        "Change(%)"
      ],
      "body": [
        {
          "field": "Net Sales",
          "val1": "1,085.89",
          "val2": "963.61",
          "chgp": "12.69%",
          "chgp_class": "positive"
        },
        {
          "field": "Operating Profit (PBDIT) excl Other Income",
          "val1": "162.33",
          "val2": "199.48",
          "chgp": "-18.62%",
          "chgp_class": "negative"
        },
        {
          "field": "Interest",
          "val1": "11.66",
          "val2": "9.78",
          "chgp": "19.22%",
          "chgp_class": "negative"
        },
        {
          "field": "Exceptional Items",
          "val1": "0.00",
          "val2": "0.00",
          "chgp": "",
          "chgp_class": "neutral"
        },
        {
          "field": "Consolidate Net Profit",
          "val1": "100.24",
          "val2": "128.33",
          "chgp": "-21.89%",
          "chgp_class": "negative"
        },
        {
          "field": "Operating Profit Margin (Excl OI)",
          "val1": "14.95%",
          "val2": "20.70%",
          "chgp": "-5.75%",
          "chgp_class": "negative"
        }
      ]
    }
  },
  {
    "link": "annual",
    "btn_text": "All Annual Results",
    "header": "Annual Results Snapshot (Consolidated) - Mar'26",
    "rhs": [
      {
        "prefix": "Net Sales ",
        "suffix": "YoY Growth in year ended Mar 2026 is 21.19% vs 10.21% in Mar 2025",
        "dir": 1
      },
      {
        "prefix": "Consolidated Net Profit ",
        "suffix": "YoY Growth in year ended Mar 2026 is 3.17% vs 3.00% in Mar 2025",
        "dir": 1
      }
    ],
    "table": {
      "header": [
        "Mar'26",
        "Mar'25",
        "Change(%)"
      ],
      "body": [
        {
          "field": "Net Sales",
          "val1": "1,503.12",
          "val2": "1,240.26",
          "chgp": "21.19%",
          "chgp_class": "positive"
        },
        {
          "field": "Operating Profit (PBDIT) excl Other Income",
          "val1": "248.79",
          "val2": "240.43",
          "chgp": "3.48%",
          "chgp_class": "positive"
        },
        {
          "field": "Interest",
          "val1": "16.38",
          "val2": "13.68",
          "chgp": "19.74%",
          "chgp_class": "negative"
        },
        {
          "field": "Exceptional Items",
          "val1": "0.00",
          "val2": "0.00",
          "chgp": "",
          "chgp_class": "neutral"
        },
        {
          "field": "Consolidate Net Profit",
          "val1": "155.10",
          "val2": "150.33",
          "chgp": "3.17%",
          "chgp_class": "positive"
        },
        {
          "field": "Operating Profit Margin (Excl OI)",
          "val1": "16.55%",
          "val2": "19.39%",
          "chgp": "-2.84%",
          "chgp_class": "negative"
        }
      ]
    }
  }
]

Quarterly Results Snapshot (Consolidated) - Jun'26 - YoYstock-summary

Jun'26
Jun'25
Change(%)
Net Sales
680.06
506.59
34.24%
Operating Profit (PBDIT) excl Other Income
166.18
100.44
65.45%
Interest
4.44
3.83
15.93%
Exceptional Items
0.00
0.00
Consolidate Net Profit
130.91
66.98
95.45%
Operating Profit Margin (Excl OI)
24.44%
19.83%
4.61%
Values in Rs Cr.
Direction Arrows
Net Sales

YoY Growth in quarter ended Jun 2026 is 34.24% vs 9.12% in Jun 2025

Direction Arrows
Consolidated Net Profit

YoY Growth in quarter ended Jun 2026 is 95.45% vs -13.48% in Jun 2025

Half Yearly Results Snapshot (Consolidated) - Sep'25stock-summary

Sep'25
Sep'24
Change(%)
Net Sales
847.21
759.76
11.51%
Operating Profit (PBDIT) excl Other Income
151.03
173.94
-13.17%
Interest
7.69
6.70
14.78%
Exceptional Items
0.00
0.00
Consolidate Net Profit
100.40
116.40
-13.75%
Operating Profit Margin (Excl OI)
17.83%
22.89%
-5.06%
Values in Rs Cr.
Direction Arrows
Net Sales

Growth in half year ended Sep 2025 is 11.51% vs 8.60% in Sep 2024

Direction Arrows
Consolidated Net Profit

Growth in half year ended Sep 2025 is -13.75% vs 6.72% in Sep 2024

Nine Monthly Results Snapshot (Consolidated) - Dec'25stock-summary

Dec'25
Dec'24
Change(%)
Net Sales
1,085.89
963.61
12.69%
Operating Profit (PBDIT) excl Other Income
162.33
199.48
-18.62%
Interest
11.66
9.78
19.22%
Exceptional Items
0.00
0.00
Consolidate Net Profit
100.24
128.33
-21.89%
Operating Profit Margin (Excl OI)
14.95%
20.70%
-5.75%
Values in Rs Cr.
Direction Arrows
Net Sales

YoY Growth in nine months ended Dec 2025 is 12.69% vs 10.27% in Dec 2024

Direction Arrows
Consolidated Net Profit

YoY Growth in nine months ended Dec 2025 is -21.89% vs 8.47% in Dec 2024

Annual Results Snapshot (Consolidated) - Mar'26stock-summary

Mar'26
Mar'25
Change(%)
Net Sales
1,503.12
1,240.26
21.19%
Operating Profit (PBDIT) excl Other Income
248.79
240.43
3.48%
Interest
16.38
13.68
19.74%
Exceptional Items
0.00
0.00
Consolidate Net Profit
155.10
150.33
3.17%
Operating Profit Margin (Excl OI)
16.55%
19.39%
-2.84%
Values in Rs Cr.
Direction Arrows
Net Sales

YoY Growth in year ended Mar 2026 is 21.19% vs 10.21% in Mar 2025

Direction Arrows
Consolidated Net Profit

YoY Growth in year ended Mar 2026 is 3.17% vs 3.00% in Mar 2025

stock-summaryCompany CV
About Vadilal Industries Ltd stock-summary
stock-summary
Vadilal Industries Ltd
Small Cap
FMCG
Vadilal Industries Limited (VIL) was incorporated under the name Vadilal Oxygen Pvt Ltd in April, 1982 to carry on the business of purification and refilling of oxygen gas and selling the same. Vadilal Ice-cream Pvt Ltd., which incorporated in June, 1981 to carry on the business of manufacturing ice-creams and ice-cream candies got amalgamated with Vadilal Oxygen from July, 1985 and subsequently, the Company's name was changed to Vadilal Industries LImited.
Company Coordinates stock-summary
Company Details
Vadilal House Shrimali Society, Navrangpura Ahmedabad Gujarat : 380009
stock-summary
Tel: 91-079-26564019-24/30153347
stock-summary
shareslogs@vadilalgroup.com
Registrar Details
MCS Ltd , 101 Shatdal Complex , 1st Floor, Opp. Bata Show Room, Ashram Road, Ahmedabad