
Compare Vadilal Inds. with Similar Stocks
Dashboard
Strong ability to service debt as the company has a low Debt to EBITDA ratio of 0.93 times
Healthy long term growth as Net Sales has grown by an annual rate of 26.49% and Operating profit at 73.61%
The company has declared positive results in Mar'2026 after 4 consecutive negative quarters
With ROCE of 19.4, it has a Attractive valuation with a 4.7 Enterprise value to Capital Employed
Despite the size of the company, domestic mutual funds hold only 0% of the company
Total Returns (Price + Dividend) 
Latest dividend: 21 per share ex-dividend date: Sep-12-2025
Risk Adjusted Returns v/s
Returns Beta

News
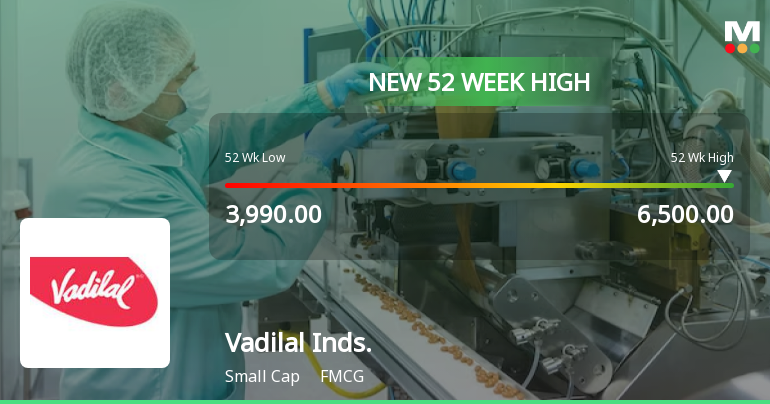
Broad-Based Technical Strength Lifts Vadilal Industries Ltd to 52-Week High of Rs 6500
With a decisive break above Rs 6500 on 7 Jul 2026, Vadilal Industries Ltd has reached a fresh 52-week high, extending a four-day winning streak that has propelled the stock up by nearly 7%. This milestone comes amid a backdrop of sustained technical momentum and outperformance relative to its FMCG sector peers.
Read full news article
MarketsMOJO Downgrades Vadilal Industries Ltd to Hold on Valuation Concerns
Vadilal Industries Ltd, a prominent player in the FMCG sector, has seen its investment rating downgraded from Buy to Hold as of 6 July 2026. This adjustment reflects a reassessment of the company’s valuation metrics amid robust financial performance and steady technical indicators. The revised rating underscores a shift in investor sentiment driven primarily by valuation concerns, despite the company’s strong operational and financial trends.
Read full news article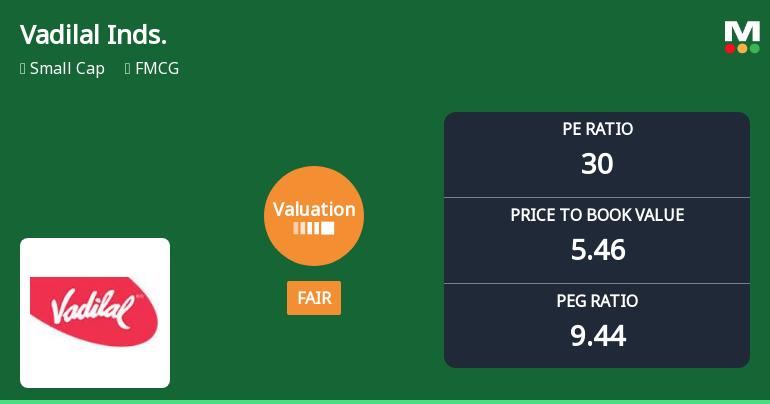
Vadilal Industries Ltd Valuation Shifts to Fair Amid Strong Market Returns
Vadilal Industries Ltd, a prominent player in the FMCG sector, has witnessed a notable shift in its valuation parameters, moving from an attractive to a fair rating. Despite this adjustment, the company continues to deliver robust returns, outperforming the Sensex significantly over multiple time horizons. This article delves into the recent valuation changes, compares them with peer benchmarks, and analyses the implications for investors.
Read full news article Announcements
Vadilal Industries Limited - Updates
27-Nov-2019 | Source : NSEVadilal Industries Limited has informed the Exchange regarding 'Transfer of shares to Investor Education & Protection Fund pursuant to Section 124(6) of the Companies Act, 2013'.
Vadilal Industries Limited - Updates
18-Nov-2019 | Source : NSEVadilal Industries Limited has informed the Exchange regarding 'Resignation of Auditor'.
Related Party Transactions
23-Sep-2019 | Source : NSE
| Vadilal Industries Limited has informed the Exchange regarding Disclosure of Related Party Transactions pursuant to Regulation 23(9) of the Securities and Exchange Board of India (Listing Obligations and Disclosure Requirements) Regulations,2015 ("Listings Regulations"). |
Corporate Actions

No Upcoming Board Meetings

Vadilal Industries Ltd has declared 210% dividend, ex-date: 12 Sep 25

No Splits history available

No Bonus history available

No Rights history available
Quality key factors
Valuation key factors
Technicals key factors
 Technical Indicator Scale: Bearish, Mildly Bearish, Sideways, Mildly Bullish, Bullish Turned
 Shareholding Snapshot : Mar 2026
Shareholding Compare (%holding)
Promoters
7.5659
Held by 1 Schemes (0.0%)
Held by 39 FIIs (0.58%)
Vadilal International Pvt Ltd (39.09%)
Kifs Trade Capital Private Limited (1.14%)
19.38%
Quarterly Results Snapshot (Consolidated) - Mar'26 - YoY

YoY Growth in quarter ended Mar 2026 is 51.21% vs 9.37% in Mar 2025
YoY Growth in quarter ended Mar 2026 is 149.36% vs -20.41% in Mar 2025
Half Yearly Results Snapshot (Consolidated) - Sep'25
Growth in half year ended Sep 2025 is 11.51% vs 8.60% in Sep 2024

Growth in half year ended Sep 2025 is -13.75% vs 6.72% in Sep 2024
Nine Monthly Results Snapshot (Consolidated) - Dec'25
YoY Growth in nine months ended Dec 2025 is 12.69% vs 10.27% in Dec 2024
YoY Growth in nine months ended Dec 2025 is -21.89% vs 8.47% in Dec 2024
Annual Results Snapshot (Consolidated) - Mar'26
YoY Growth in year ended Mar 2026 is 21.19% vs 10.21% in Mar 2025
YoY Growth in year ended Mar 2026 is 3.17% vs 3.00% in Mar 2025
About Vadilal Industries Ltd

Company Coordinates


