
Compare Vani Commercials with Similar Stocks
Stock DNA
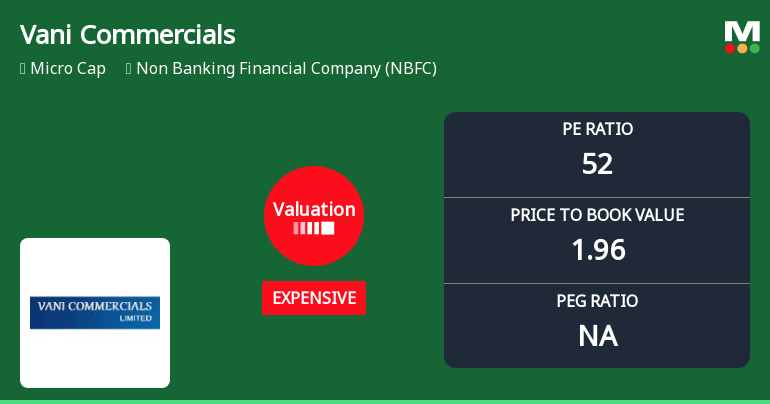
Non Banking Financial Company (NBFC)
INR 25 Cr (Micro Cap)
50.00
21
0.00%
0.00
4.89%
1.87
Total Returns (Price + Dividend) 
Vani Commercials for the last several years.
Risk Adjusted Returns v/s
Returns Beta

News
Vani Commercials Ltd Valuation Shifts Amidst NBFC Sector Challenges
Vani Commercials Ltd, a micro-cap player in the Non Banking Financial Company (NBFC) sector, has experienced a notable shift in its valuation parameters, moving from a very expensive to an expensive rating. This change reflects evolving market perceptions and has implications for its price attractiveness relative to peers and historical benchmarks. Despite a recent day gain of 3.41%, the company’s valuation metrics and returns continue to pose challenges for investors seeking value in the NBFC space.
Read full news articleWhen is the next results date for Vani Commercials Ltd?
The next results date for Vani Commercials Ltd is scheduled for 21 May 2026....
Read full news article
Vani Commercials Ltd is Rated Strong Sell
Vani Commercials Ltd is rated Strong Sell by MarketsMOJO, with this rating last updated on 23 Feb 2026. However, the analysis and financial metrics discussed here reflect the stock’s current position as of 14 May 2026, providing investors with the latest insights into its performance and outlook.
Read full news article Announcements
Compliances-Reg.24(A)-Annual Secretarial Compliance
08-Jun-2026 | Source : BSEREVISED ANNUAL SECRETARIAL COMPLIANCE REPORT- REGULATION 24 A OF SEBI (LODR) REGULATIONS 2015
Announcement under Regulation 30 (LODR)-Newspaper Publication
25-May-2026 | Source : BSESubmission of Newspaper Publication of Financial Results for the Quarter and Financial Year ended March 31 2026
Submission Of Half Yearly Related Party Disclosure
22-May-2026 | Source : BSEPlease find the enclosed Half yearly related party disclosure for the half year ended 31st March 2026
Corporate Actions

No Upcoming Board Meetings

No Dividend history available

No Splits history available

No Bonus history available

No Rights history available
Quality key factors
Valuation key factors
Technicals key factors
 Technical Indicator Scale: Bearish, Mildly Bearish, Sideways, Mildly Bullish, Bullish Turned
 Shareholding Snapshot : Mar 2026
Shareholding Compare (%holding)
Non Institution
None
Held by 0 Schemes
Held by 0 FIIs
None
Boolean Ventura Private Limited (9.5%)
28.0%
Quarterly Results Snapshot (Standalone) - Mar'26 - QoQ

QoQ Growth in quarter ended Mar 2026 is 15,400.00% vs -94.44% in Dec 2025

QoQ Growth in quarter ended Mar 2026 is -60.87% vs 35.29% in Dec 2025
Half Yearly Results Snapshot (Standalone) - Sep'25
Growth in half year ended Sep 2025 is -44.03% vs 17.03% in Sep 2024
Growth in half year ended Sep 2025 is 44.00% vs 0.00% in Sep 2024
Nine Monthly Results Snapshot (Standalone) - Dec'25
YoY Growth in nine months ended Dec 2025 is -56.86% vs -1.13% in Dec 2024
YoY Growth in nine months ended Dec 2025 is 47.50% vs 60.00% in Dec 2024
Annual Results Snapshot (Standalone) - Mar'26
YoY Growth in year ended Mar 2026 is 68.44% vs 7.96% in Mar 2025
YoY Growth in year ended Mar 2026 is -25.00% vs 100.00% in Mar 2025
About Vani Commercials Ltd

Company Coordinates


