
Compare Vardhman Special with Similar Stocks
Dashboard
Strong ability to service debt as the company has a low Debt to EBITDA ratio of 0.56 times
Poor long term growth as Net Sales has grown by an annual rate of 13.36% and Operating profit at 12.81% over the last 5 years
Positive results in Mar 26
With ROE of 9.6, it has a Very Expensive valuation with a 2.1 Price to Book Value
Majority shareholders : Promoters
Market Beating performance in long term as well as near term
Stock DNA
Iron & Steel Products
INR 2,872 Cr (Small Cap)
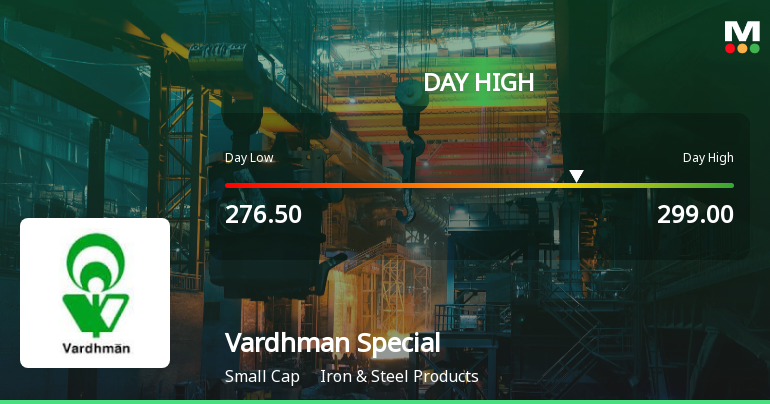
29.00
26
1.08%
-0.09
9.55%
2.09
Total Returns (Price + Dividend) 
Latest dividend: 3 per share ex-dividend date: Sep-12-2025
Risk Adjusted Returns v/s
Returns Beta

News
Vardhman Special Steels Ltd Surges 7.31% to Day's High of Rs 295.35 — Outperforms Sector by 7.37 Percentage Points
The Sensex declined by 0.38% on 13 Jul 2026, while Vardhman Special Steels Ltd surged 7.31%, marking a remarkable 7.37 percentage-point outperformance over its Iron & Steel Products sector. This sharp single-session gain rewrites the short-term narrative for the small-cap stock, which has been steadily advancing over the past three days.
Read full news article
Vardhman Special Steels Ltd is Rated Hold by MarketsMOJO
Vardhman Special Steels Ltd is rated 'Hold' by MarketsMOJO, with this rating last updated on 15 June 2026. However, the analysis and financial metrics discussed here reflect the stock's current position as of 08 July 2026, providing investors with the latest insights into its performance and valuation.
Read full news article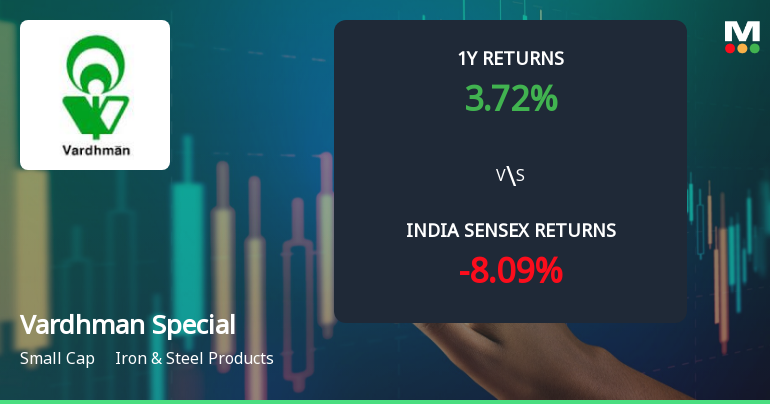
Vardhman Special Steels Ltd Technical Momentum Shifts Amid Mixed Indicator Signals
Vardhman Special Steels Ltd has experienced a nuanced shift in its technical momentum, moving from a bullish to a mildly bullish stance as of early July 2026. Despite a modest day decline of 1.55%, the stock’s technical indicators present a complex picture, with weekly signals largely positive but monthly trends showing caution. This analysis delves into the recent technical parameter changes, key momentum indicators, and what these mean for investors navigating the iron and steel products sector.
Read full news article Announcements
Compliances-Certificate under Reg. 74 (5) of SEBI (DP) Regulations 2018
08-Jul-2026 | Source : BSEPlease find enclosed herewith certificate under Regulation 74(5) of SEBI (DP) Regulations 2015.
Update On Investment In Sone Solar Private Limited.
08-Jul-2026 | Source : BSEPlease find enclosed herewith intimation regarding update on investment in Sone Solar Private Limited.
Demat Report For The Month Ended June 2026.
07-Jul-2026 | Source : BSEPlease find enclosed herewith Demat Report for the month ended June 2026.
Corporate Actions

No Upcoming Board Meetings

Vardhman Special Steels Ltd has declared 30% dividend, ex-date: 12 Sep 25

No Splits history available

Vardhman Special Steels Ltd has announced 1:1 bonus issue, ex-date: 26 May 23

Vardhman Special Steels Ltd has announced 2:3 rights issue, ex-date: 07 Apr 17
Quality key factors
Valuation key factors
Technicals key factors
 Technical Indicator Scale: Bearish, Mildly Bearish, Sideways, Mildly Bullish, Bullish Turned
 Shareholding Snapshot : Jun 2026
Shareholding Compare (%holding)
Promoters
None
Held by 6 Schemes (3.23%)
Held by 27 FIIs (0.55%)
Vardhman Textiles Limited (20.08%)
Aichi Steel Corporation (24.85%)
16.68%
Quarterly Results Snapshot (Standalone) - Mar'26 - QoQ

QoQ Growth in quarter ended Mar 2026 is 6.36% vs -0.40% in Dec 2025
QoQ Growth in quarter ended Mar 2026 is 1.16% vs -2.81% in Dec 2025
Half Yearly Results Snapshot (Standalone) - Sep'25

Growth in half year ended Sep 2025 is -4.80% vs 10.31% in Sep 2024
Growth in half year ended Sep 2025 is 4.93% vs 40.16% in Sep 2024
Nine Monthly Results Snapshot (Standalone) - Dec'25
YoY Growth in nine months ended Dec 2025 is -2.98% vs 9.36% in Dec 2024
YoY Growth in nine months ended Dec 2025 is 20.02% vs 24.68% in Dec 2024
Annual Results Snapshot (Standalone) - Mar'26
YoY Growth in year ended Mar 2026 is -0.57% vs 6.20% in Mar 2025
YoY Growth in year ended Mar 2026 is 31.08% vs 1.59% in Mar 2025
About Vardhman Special Steels Ltd

Company Coordinates


