
 Price Point
Compare Varroc Engineer with Similar Stocks
ScoreDashboard
Low ability to service debt as the company has a high Debt to EBITDA ratio of 1.11 times
- Low ability to service debt as the company has a high Debt to EBITDA ratio of 1.11 times
Healthy long term growth as Operating profit has grown by an annual rate 29.53%
The company has declared Positive results for the last 5 consecutive quarters
With ROCE of 20.2, it has a Expensive valuation with a 5.5 Enterprise value to Capital Employed
Majority shareholders : Promoters
Market Beating performance in long term as well as near term
Mojo ParametersStock DNA

Auto Components & Equipments

INR 12,696 Cr (Small Cap)

42.00
40

0.18%

0.38

15.97%

7.19
Total ReturnsTotal Returns (Price + Dividend) 
Latest dividend: 1.5000000000000002 per share ex-dividend date: Aug-07-2026
Risk Adjusted Returns v/s
Returns Beta
 News & Corporate Actions
News
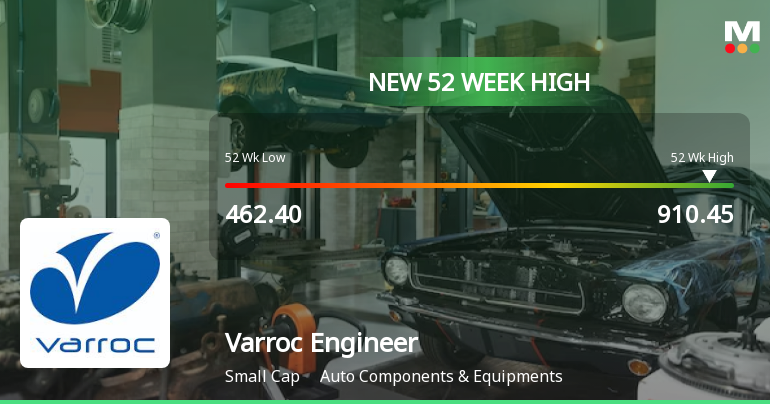
Broad-Based Technical Strength Lifts Varroc Engineering Ltd to 52-Week High of Rs 910.45
With a decisive surge to Rs 910.45 on 22 Sep 2026, Varroc Engineering Ltd has reached a fresh 52-week high, marking a 38.42% gain over the past year and outpacing the Sensex’s decline of 8.74%. This milestone reflects a strong alignment of technical indicators and sustained price momentum that has propelled the stock well above its key moving averages.
Read full news article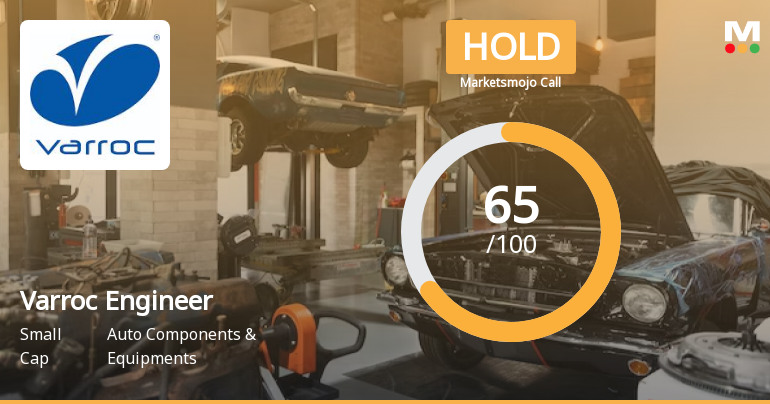
Varroc Engineering Ltd is Rated Hold by MarketsMOJO
Varroc Engineering Ltd is rated 'Hold' by MarketsMOJO, a rating that was last updated on 04 May 2026. While this rating change occurred several months ago, the analysis below reflects the stock’s current fundamentals, returns, and financial metrics as of 20 September 2026, providing investors with an up-to-date perspective on the company’s standing.
Read full news article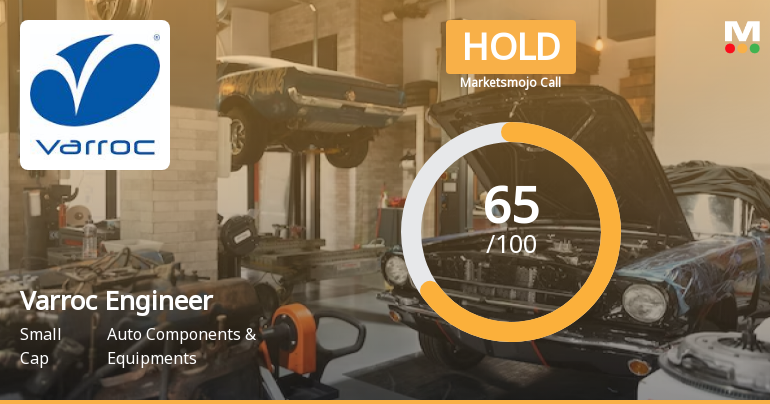
Varroc Engineering Ltd is Rated Hold by MarketsMOJO
Varroc Engineering Ltd is rated 'Hold' by MarketsMOJO, with this rating last updated on 04 May 2026. However, the analysis and financial metrics discussed here reflect the stock's current position as of 09 September 2026, providing investors with an up-to-date perspective on the company’s performance and outlook.
Read full news article Announcements
Varroc Engineering Limited - Publish Audited Results
14-Nov-2019 | Source : NSEVarroc Engineering Limited has informed the Exchange regarding Submission of Newspaper Publication of Financial Results for the quarter and half year ended September 30, 2019
Varroc Engineering Limited - Press Release (Revised)
13-Nov-2019 | Source : NSEVarroc Engineering Limited has informed the Exchange regarding a revised press release dated November 12, 2019, titled "Press Release - Financial Results Q2 2019-20 ".
Varroc Engineering Limited - Analysts/Institutional Investor Meet/Con. Call Updates
04-Nov-2019 | Source : NSEVarroc Engineering Limited has informed the Exchange regarding Analysts/Institutional Investor Meet/Con. Call Updates for the Unaudited Financial Results for the quarter and half year ended on September 30, 2019 scheduled on Tuesday, November 12, 2019 at 05:00 p.m.
Corporate Actions

No Upcoming Board Meetings

Varroc Engineering Ltd has declared 150% dividend, ex-date: 07 Aug 26

No Splits history available

No Bonus history available

No Rights history available
Key FactorsQuality key factors
Valuation key factors
Technicals key factors
 Technical Indicator Scale: Bearish, Mildly Bearish, Sideways, Mildly Bullish, Bullish Turned Shareholding
Shareholding Snapshot : Jun 2026
Shareholding Compare (%holding)
Promoters
None
Held by 9 Schemes (9.79%)
Held by 78 FIIs (4.29%)
Tarang Jain (39.74%)
Hdfc Trustee Company Limited-hdfc Flexi Cap Fund (7.37%)
7.41%
FinancialQuarterly Results Snapshot (Consolidated) - Jun'26 - QoQ
 Compare with Peers
QoQ Growth in quarter ended Jun 2026 is 11.24% vs 3.52% in Mar 2026

QoQ Growth in quarter ended Jun 2026 is 11.47% vs 773.01% in Mar 2026

Half Yearly Results Snapshot (Consolidated) - Sep'25
Growth in half year ended Sep 2025 is 6.41% vs 7.78% in Sep 2024
Growth in half year ended Sep 2025 is 88.48% vs 1.85% in Sep 2024
Nine Monthly Results Snapshot (Consolidated) - Dec'25
YoY Growth in nine months ended Dec 2025 is 7.72% vs 8.57% in Dec 2024
YoY Growth in nine months ended Dec 2025 is 283.05% vs -91.34% in Dec 2024
Annual Results Snapshot (Consolidated) - Mar'26
YoY Growth in year ended Mar 2026 is 9.03% vs 7.97% in Mar 2025
YoY Growth in year ended Mar 2026 is 267.52% vs -88.36% in Mar 2025
 Company CV
About Varroc Engineering Ltd










