
Compare Vasundhara Rasy. with Similar Stocks
Dashboard
Weak Long Term Fundamental Strength with a -6.46% CAGR growth in Operating Profits over the last 5 years
- PBT LESS OI(Q) At Rs 0.30 cr has Fallen at -63.2% (vs previous 4Q average)
- PAT(Q) At Rs 0.72 cr has Fallen at -36.4% (vs previous 4Q average)
- NET SALES(Q) Lowest at Rs 7.45 cr
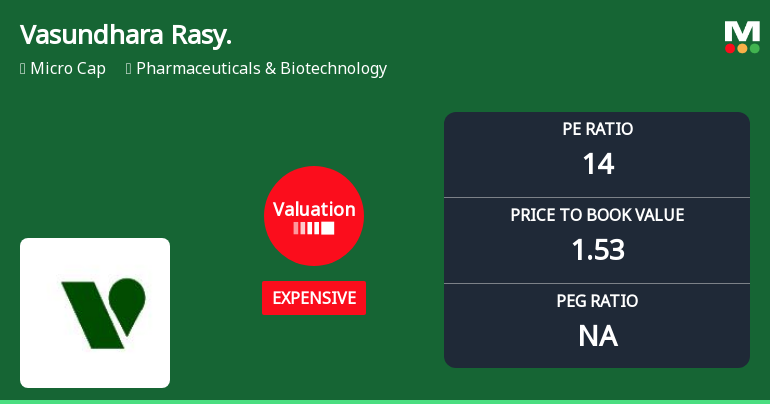
With ROE of 10.7, it has a Expensive valuation with a 1.5 Price to Book Value
Underperformed the market in the last 1 year
Stock DNA
Pharmaceuticals & Biotechnology
INR 57 Cr (Micro Cap)
14.00
43
1.17%
-0.04
10.69%
1.53
Total Returns (Price + Dividend) 
Latest dividend: 1.9741293532338309 per share ex-dividend date: Sep-19-2025
Risk Adjusted Returns v/s
Returns Beta

News
Vasundhara Rasayans Ltd Valuation Shifts Signal Price Attractiveness Change
Vasundhara Rasayans Ltd, a micro-cap player in the Pharmaceuticals & Biotechnology sector, has seen a notable shift in its valuation parameters, moving from a very expensive to an expensive rating. This change reflects evolving market perceptions and impacts the stock’s price attractiveness amid a challenging sector backdrop and mixed financial metrics.
Read full news article
Vasundhara Rasayans Ltd is Rated Strong Sell
Vasundhara Rasayans Ltd is rated Strong Sell by MarketsMOJO, with this rating last updated on 17 Dec 2025. However, the analysis and financial metrics presented here reflect the stock’s current position as of 18 June 2026, providing investors with an up-to-date view of the company’s fundamentals, valuation, financial trend, and technical outlook.
Read full news article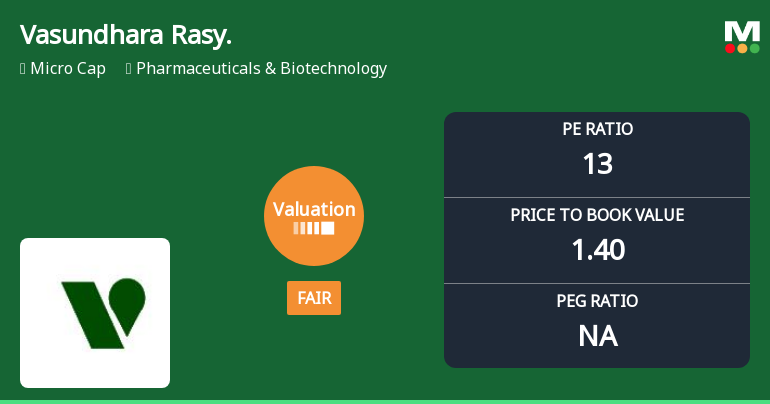
Vasundhara Rasayans Ltd Valuation Shifts Signal Renewed Price Attractiveness
Vasundhara Rasayans Ltd, a micro-cap player in the Pharmaceuticals & Biotechnology sector, has seen a notable shift in its valuation parameters, moving from a very expensive rating to a fair valuation grade. This change, coupled with its current price-to-earnings (P/E) ratio of 13.14 and price-to-book value (P/BV) of 1.40, suggests a more attractive entry point for investors compared to its historical and peer averages.
Read full news article Announcements
Compliances-Reg.24(A)-Annual Secretarial Compliance
30-May-2026 | Source : BSEANNUAL SECRETARIAL COMPLIANCE REPORT FOR THE FY 2025-26
Announcement under Regulation 30 (LODR)-Newspaper Publication
30-May-2026 | Source : BSENewspaper Advertisement pertaining Audited financial results for the quarter and year ended on 31.03.2026
Announcement under Regulation 30 (LODR)-Memorandum of Understanding /Agreements
28-May-2026 | Source : BSEThe Board of Directors in its meeting held on 28th May 2026 has approved and taken on records the entering into of a Memorandum of Understanding cum Loan-lease agreement with PandJ Cretechem Private Limited (the Holding Company) for a manufacturing arrangement for Active Pharmaceutical Ingredients (APIs) at the Holding companys manufacturing facility located at Dahej Gujarat
Corporate Actions

No Upcoming Board Meetings

Vasundhara Rasayans Ltd has declared 20% dividend, ex-date: 19 Sep 25

No Splits history available

No Bonus history available

No Rights history available
Quality key factors
Valuation key factors
Technicals key factors
 Technical Indicator Scale: Bearish, Mildly Bearish, Sideways, Mildly Bullish, Bullish Turned
 Shareholding Snapshot : Mar 2026
Shareholding Compare (%holding)
Promoters
None
Held by 0 Schemes
Held by 0 FIIs
P & J Cretechem Private Limited (61.98%)
Garg Leasing And Finance Private Limited (3.55%)
30.2%
Quarterly Results Snapshot (Standalone) - Dec'25 - QoQ

QoQ Growth in quarter ended Dec 2025 is -15.53% vs 16.67% in Sep 2025
QoQ Growth in quarter ended Dec 2025 is -65.05% vs 261.40% in Sep 2025
Half Yearly Results Snapshot (Standalone) - Sep'25
Growth in half year ended Sep 2025 is -5.92% vs -1.36% in Sep 2024

Growth in half year ended Sep 2025 is 12.88% vs -0.43% in Sep 2024
Nine Monthly Results Snapshot (Standalone) - Dec'25
YoY Growth in nine months ended Dec 2025 is -9.15% vs 1.35% in Dec 2024
YoY Growth in nine months ended Dec 2025 is -11.38% vs 1.61% in Dec 2024
Annual Results Snapshot (Standalone) - Mar'25
YoY Growth in year ended Mar 2025 is -8.18% vs -2.42% in Mar 2024
YoY Growth in year ended Mar 2025 is -27.47% vs 4.83% in Mar 2024
About Vasundhara Rasayans Ltd

Company Coordinates


