
Compare Veerhealth Care with Similar Stocks
Dashboard
Weak Long Term Fundamental Strength with an average Return on Equity (ROE) of 2.92%
- Company's ability to service its debt is weak with a poor EBIT to Interest (avg) ratio of -0.06
The company has declared Positive results for the last 5 consecutive quarters
With ROCE of 4.4, it has a Expensive valuation with a 2 Enterprise value to Capital Employed
Majority shareholders : Non Institution
Market Beating performance in long term as well as near term
Stock DNA
Pharmaceuticals & Biotechnology
INR 49 Cr (Micro Cap)
58.00
21
0.00%
0.18
3.71%
2.12
Total Returns (Price + Dividend) 
Veerhealth Care for the last several years.
Risk Adjusted Returns v/s
Returns Beta

News

Veerhealth Care Ltd is Rated Hold by MarketsMOJO
Veerhealth Care Ltd is rated 'Hold' by MarketsMOJO, with this rating last updated on 20 April 2026. While the rating was revised on that date, the analysis and financial metrics presented here reflect the stock's current position as of 04 June 2026, providing investors with the latest insights into its performance and outlook.
Read full news article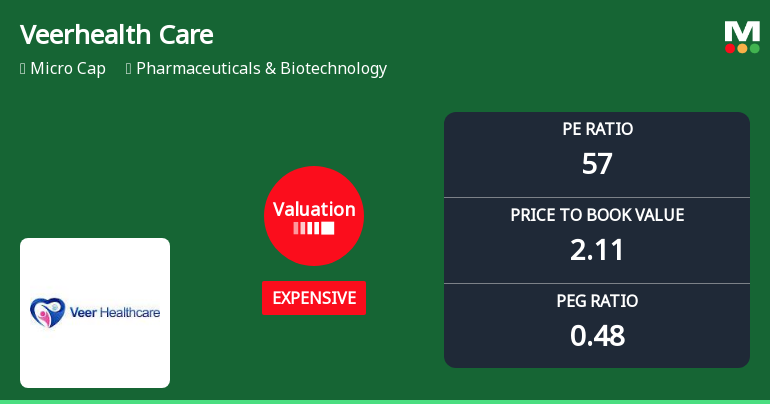
Veerhealth Care Ltd Valuation Shifts: Price Attractiveness Under the Lens
Veerhealth Care Ltd, a micro-cap player in the Pharmaceuticals & Biotechnology sector, has experienced a notable shift in its valuation parameters, moving from a very expensive to an expensive rating. This change reflects evolving market perceptions and invites a closer examination of its price-to-earnings (P/E) and price-to-book value (P/BV) ratios relative to historical trends and peer benchmarks.
Read full news articleAre Veerhealth Care Ltd latest results good or bad?
Veerhealth Care Ltd's latest financial results for Q4 FY26 present a complex picture of growth and challenges. The company reported net sales of ₹16.76 crores, reflecting a substantial quarter-on-quarter growth of 130.85% and a year-on-year increase of 198.22%. This topline expansion indicates a significant surge in revenue, which may suggest strong order execution or market share gains. However, the operational performance raises concerns. The company recorded a net loss of ₹0.35 crores, a stark contrast to the profit of ₹0.40 crores in the previous quarter. This shift highlights a deterioration in profitability, primarily driven by an extraordinary tax charge that resulted in an effective tax rate of 294.44%. Such a high tax rate transformed what would have been a modest profit into a loss, raising questions about the sustainability of earnings quality. Moreover, the company's profit margins have signif...
Read full news article Announcements
Announcement under Regulation 30 (LODR)-Press Release / Media Release
02-Jun-2026 | Source : BSEAttached herewith the press release for the audited financial results for March 2026.
Announcement under Regulation 30 (LODR)-Newspaper Publication
01-Jun-2026 | Source : BSEPlease find attached herewith the newspaper advertisement done today pertaining to audited financial results for March 2026
Results For The 31St March 2026
30-May-2026 | Source : BSEEnclosed herewith audited financials for 31st march 2026
Corporate Actions

No Upcoming Board Meetings

No Dividend history available

Veerhealth Care Ltd has announced 10:1 stock split, ex-date: 29 Nov 16

Veerhealth Care Ltd has announced 1:1 bonus issue, ex-date: 22 Sep 23

No Rights history available
Quality key factors
Valuation key factors
Technicals key factors
 Technical Indicator Scale: Bearish, Mildly Bearish, Sideways, Mildly Bullish, Bullish Turned
 Shareholding Snapshot : Mar 2026
Shareholding Compare (%holding)
Non Institution
None
Held by 0 Schemes
Held by 0 FIIs
Yogesh Mahasuklal Shah (12.23%)
Rishabh Fintrade (2.72%)
54.27%
Quarterly Results Snapshot (Standalone) - Mar'26 - QoQ

QoQ Growth in quarter ended Mar 2026 is 130.85% vs 82.41% in Dec 2025

QoQ Growth in quarter ended Mar 2026 is -187.50% vs 60.00% in Dec 2025
Half Yearly Results Snapshot (Standalone) - Sep'25
Growth in half year ended Sep 2025 is 17.48% vs -2.70% in Sep 2024
Growth in half year ended Sep 2025 is 16.67% vs -42.47% in Sep 2024
Nine Monthly Results Snapshot (Standalone) - Dec'25
YoY Growth in nine months ended Dec 2025 is 42.35% vs 7.49% in Dec 2024
YoY Growth in nine months ended Dec 2025 is 81.63% vs -46.74% in Dec 2024
Annual Results Snapshot (Standalone) - Mar'26
YoY Growth in year ended Mar 2026 is 92.53% vs 27.61% in Mar 2025
YoY Growth in year ended Mar 2026 is 38.46% vs -4.88% in Mar 2025
About Veerhealth Care Ltd

Company Coordinates


