
Compare Veranda Learning with Similar Stocks
Dashboard
Weak Long Term Fundamental Strength with an average Return on Capital Employed (ROCE) of 2.07%
- Low ability to service debt as the company has a high Debt to EBITDA ratio of 2.29 times
With a growth in Net Sales of 13.35%, the company declared Outstanding results in Mar 26
With ROCE of 8.3, it has a Attractive valuation with a 2 Enterprise value to Capital Employed
30.45% of Promoter Shares are Pledged
Stock DNA
Other Consumer Services
INR 2,235 Cr (Small Cap)
67.00
171
0.00%
0.37
3.45%
2.33
Total Returns (Price + Dividend) 
Veranda Learning for the last several years.
Risk Adjusted Returns v/s
Returns Beta

News

Veranda Learning Solutions Ltd Technical Momentum Shifts Amid Mixed Market Signals
Veranda Learning Solutions Ltd has experienced a nuanced shift in its technical momentum, with key indicators signalling a transition from bullish to mildly bullish territory. Despite a modest day decline of 1.48%, the stock’s broader technical landscape reveals a complex interplay of bullish and bearish signals across weekly and monthly timeframes, prompting a reassessment of its near-term outlook.
Read full news article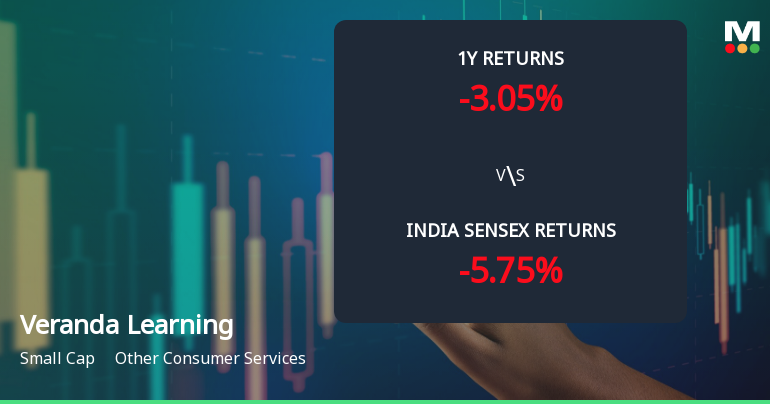
Veranda Learning Solutions Ltd Sees Bullish Momentum Shift Amid Technical Upgrades
Veranda Learning Solutions Ltd has experienced a notable shift in price momentum, supported by a series of bullish technical indicators and an upgrade in its overall market rating. The stock’s recent performance, combined with improved technical signals such as MACD and moving averages, suggests a strengthening trend that investors should closely monitor.
Read full news article
Veranda Learning Solutions Ltd is Rated Hold
Veranda Learning Solutions Ltd is rated 'Hold' by MarketsMOJO, with this rating last updated on 16 June 2026. However, all fundamentals, returns, and financial metrics discussed here reflect the stock's current position as of 20 July 2026, providing investors with an up-to-date analysis of the company’s standing.
Read full news article Announcements
Announcement Under Regulation 30 (LODR) - Updates
29-Jul-2026 | Source : BSEPlease find the enclosed.
Announcement under Regulation 30 (LODR)-Press Release / Media Release
24-Jul-2026 | Source : BSEPlease find the enclosed press release.
Announcement Under Regulation 30 - Letter To Shareholders
16-Jul-2026 | Source : BSEPlease find the enclosed Intimation
Corporate Actions

No Upcoming Board Meetings

No Dividend history available

No Splits history available

No Bonus history available

No Rights history available
Quality key factors
Valuation key factors
Technicals key factors
 Technical Indicator Scale: Bearish, Mildly Bearish, Sideways, Mildly Bullish, Bullish Turned
 Shareholding Snapshot : Jun 2026
Shareholding Compare (%holding)
Non Institution
30.4542
Held by 0 Schemes
Held by 22 FIIs (2.83%)
Kalpathi S Aghoram (10.62%)
Authum Investment And Infrastructure Limited (10.81%)
36.78%
Quarterly Results Snapshot (Consolidated) - Mar'26 - QoQ

QoQ Growth in quarter ended Mar 2026 is 13.35% vs -7.84% in Dec 2025
QoQ Growth in quarter ended Mar 2026 is -14.66% vs -89.18% in Dec 2025
Half Yearly Results Snapshot (Consolidated) - Sep'25
Growth in half year ended Sep 2025 is 20.16% vs 15.63% in Sep 2024
Growth in half year ended Sep 2025 is 259.59% vs -178.26% in Sep 2024
Nine Monthly Results Snapshot (Consolidated) - Dec'25
YoY Growth in nine months ended Dec 2025 is 19.36% vs 12.91% in Dec 2024
YoY Growth in nine months ended Dec 2025 is 141.65% vs -555.01% in Dec 2024
Annual Results Snapshot (Consolidated) - Mar'26
YoY Growth in year ended Mar 2026 is 34.60% vs -1.11% in Mar 2025
YoY Growth in year ended Mar 2026 is 142.66% vs -210.32% in Mar 2025
About Veranda Learning Solutions Ltd

Company Coordinates


