
Compare Viatris, Inc. with Similar Stocks
Dashboard
Poor Management Efficiency with a low ROCE of 4.26%
- The company has been able to generate a Return on Capital Employed (avg) of 4.26% signifying low profitability per unit of total capital (equity and debt)
The company has declared negative results for the last 2 consecutive quarters
Risky -
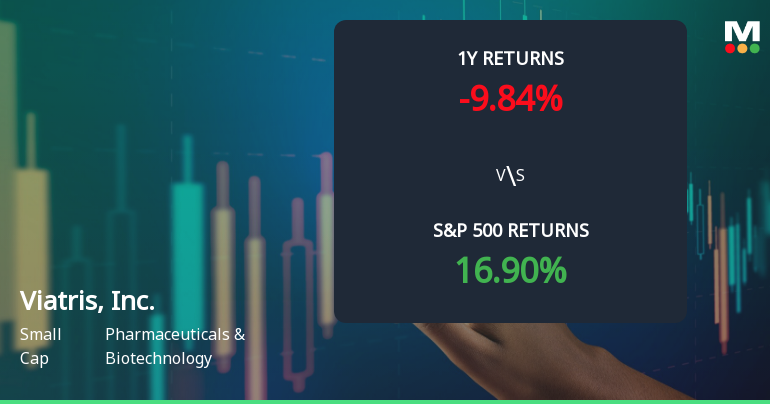
Consistent Underperformance against the benchmark over the last 3 years
Stock DNA
Pharmaceuticals & Biotechnology
USD 15,031 Million (Small Cap)
38.00
NA
86.47%
0.88
-2.14%
0.99
Total Returns (Price + Dividend) 
Viatris, Inc. for the last several years.
Risk Adjusted Returns v/s
News
Viatris, Inc. Experiences Revision in Stock Evaluation Amid Mixed Market Signals
Viatris, Inc. has recently revised its evaluation amid fluctuating market conditions, with its stock priced at $10.35. The company has experienced significant volatility over the past year, with mixed technical indicators and varied performance compared to the S&P 500, reflecting both challenges and opportunities in the pharmaceutical sector.
Read full news article Announcements

Corporate Actions
Quality key factors
Valuation key factors
Technicals key factors
 Technical Indicator Scale: Bearish, Mildly Bearish, Sideways, Mildly Bullish, Bullish Turned
 Shareholding Snapshot : Sep 2025
Shareholding Compare (%holding)
Domestic Funds
Held in 124 Schemes (43.67%)
Held by 370 Foreign Institutions (12.64%)
Quarterly Results Snapshot (Consolidated) - Jun'25 - QoQ

QoQ Growth in quarter ended Jun 2025 is 10.39% vs -6.66% in Mar 2025
QoQ Growth in quarter ended Jun 2025 is 99.85% vs -488.96% in Mar 2025
Annual Results Snapshot (Consolidated) - Dec'24
YoY Growth in year ended Dec 2024 is -4.37% vs -4.90% in Dec 2023

YoY Growth in year ended Dec 2024 is -1,259.41% vs -97.37% in Dec 2023
About Viatris, Inc.

Company Coordinates


