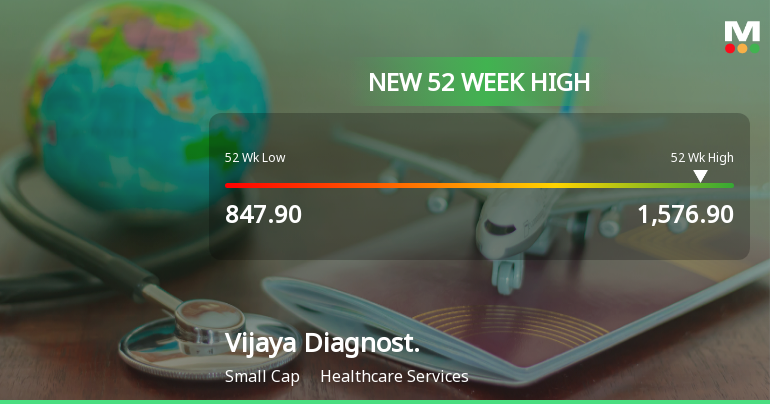
Vijaya Diagnost.

  • Market Cap: Small Cap
  • Industry: Healthcare Services
  • ISIN: INE043W01024
  • NSEID: VIJAYA
  • BSEID: 543350
INR
1,515.00
11.65 (0.77%)
BSENSE

Sep 09, 11:01 AM

BSE+NSE Vol: 3.71 lacs

  • Price Points
  • Score
  • Mojo Parameters
  • Total Return
  • News and Corporate Actions
  • Key factors
  • Shareholding
  • Financials
  • CompanyCV
stock-summaryPrice Point
High/Low

1Day

52 Week

Valuation
Technical
Day's Volume

CASH

3.71 lacs (1,003.84%) Volume

Shareholding (Jun 2026)

FII

11.66%

Held by 132 FIIs

DII

31.61%

Held by 44 DIIs

Promoter

52.51%

Which are the latest news on Vijaya Diagnost.?

08-Sep-2026

Why is Vijaya Diagnostic Centre Ltd falling/rising?

06-Sep-2026

As of 05-Sep, Vijaya Diagnostic Centre Ltd's stock price is 1,496.35, down 0.64%, but it has increased by 40.89% year-to-date. Despite strong financial performance and high management efficiency, concerns over long-term growth and reduced investor participation may be impacting its current price.

As of 05-Sep, Vijaya Diagnostic Centre Ltd's stock price is currently at 1,496.35, reflecting a decrease of 9.6 points or 0.64%. Despite this decline, the stock has shown positive performance over various time frames, with a 3.07% increase over the past week and an impressive 8.11% rise over the past month. Year-to-date, the stock has surged by 40.89%, significantly outperforming the Sensex, which has fallen by 10.21% in the same period.<BR><BR>The stock's current price is 3.73% away from its 52-week high of Rs 1545.55, indicating that it is still trading near its peak. Furthermore, Vijaya Diagnostic Centre Ltd is performing well relative to its moving averages, trading above the 5-day, 20-day, 50-day, 100-day, and 200-day averages. However, there is a notable decline in investor participation, with delivery volume dropping by 63.75% against the 5-day average, which may contribute to the current price drop.<BR><BR>Positive factors supporting the stock include high management efficiency, as evidenced by a return on capital employed (ROCE) of 22.48%, and a low debt-to-equity ratio of 0.09. The company has also reported strong financial results, with net sales growing by 23.63% and profit after tax increasing by 31.86% over the past nine months. Additionally, high institutional holdings at 43.26% suggest confidence from more sophisticated investors.<BR><BR>Conversely, risks include concerns over long-term growth, as net sales have only grown at an annual rate of 13.87% over the last five years. The stock is considered expensive, trading at a premium compared to its peers, with a PEG ratio of 3.5, indicating that while the stock has performed well recently, its valuation may not be justified by its growth rates.<BR><BR>In summary, while Vijaya Diagnostic Centre Ltd has shown strong performance metrics and positive financial results, the recent price decline may be attributed to reduced investor participation and concerns over long-term growth potential.

View full answer

Who are in the management team of Vijaya Diagnost.?

01-Sep-2026

The management team of Vijaya Diagnost includes Sura Surendranath Reddy (Chairman & Executive Director), Sura Suprita Reddy (Managing Director & CEO), and several independent and non-executive directors, ensuring a blend of leadership and oversight.

The management team of Vijaya Diagnost includes the following individuals:<BR><BR>1. **Sura Surendranath Reddy** - Chairman & Executive Director<BR>2. **Sunil Chandra Kondapally** - Executive Director<BR>3. **Geeta Reddy** - Non-Executive & Non-Independent Director<BR>4. **C S N Murthy** - Independent Non-Executive Director<BR>5. **DUVVURU NAGESHWAR REDDY** - Independent Non-Executive Director<BR>6. **SEKHAR PRASAD SINGH** - Independent Non-Executive Director<BR>7. **Manjula Anagani** - Independent Non-Executive Director<BR>8. **Sura Suprita Reddy** - Managing Director & CEO<BR><BR>This team brings a mix of executive leadership and independent oversight to the company.

View full answer

What does Vijaya Diagnost. do?

01-Sep-2026

Vijaya Diagnostic Centre Ltd is a leading diagnostic services provider in Southern India, established in 1981, with recent net sales of 231 Cr and net profit of 53 Cr as of June 2026. It has a market cap of INR 14,965 Cr and key metrics include a P/E of 84.00 and a return on equity of 18.07%.

Overview: <BR>Vijaya Diagnostic Centre Ltd is a leading provider of diagnostic services in the healthcare services industry, categorized as a small-cap company.<BR><BR>History: <BR>Incorporated in 1981, Vijaya Diagnostic Centre has established itself as the largest integrated diagnostic chain in Southern India. The latest quarterly results reported net sales and net profit for June 2026.<BR><BR>Financial Snapshot: <BR>Most recent Net Sales: 231 Cr (Quarterly Results - Jun 2026) <BR>Most recent Net Profit: 53 Cr (Quarterly Results - Jun 2026) <BR>Market-cap value: INR 14,965 Cr (Small Cap)<BR><BR>Key Metrics: <BR>P/E: 84.00 <BR>Industry P/E: 67 <BR>Dividend Yield: 0.14% <BR>Debt-Equity: 0.15 <BR>Return on Equity: 18.07% <BR>Price to Book: 15.60 <BR><BR>Contact Details: <BR>Details: No Company Details Available <BR>Registrar Address: Not available.

View full answer

Who are the peers of the Vijaya Diagnost.?

01-Sep-2026

Vijaya Diagnost.'s peers include Dr Lal Pathlabs, Poly Medicure, Syngene Intl., Indegene, Metropolis Healt, Suven Life Scie., Thyrocare Tech., and Vimta Labs. Among these, Vijaya Diagnost. shows good growth and a 1-year return of 50.91%, while Suven Life Scie. leads with an 84.49% return, and Syngene Intl. has the lowest return at -35.90%.

Peers: The peers of Vijaya Diagnost. are Dr Lal Pathlabs, Poly Medicure, Syngene Intl., Indegene, Metropolis Healt, Suven Life Scie., Thyrocare Tech., and Vimta Labs.<BR><BR>Quality Snapshot: Excellent management risk is observed at Dr Lal Pathlabs and Thyrocare Tech., while Good management risk is found at Poly Medicure, Syngene Intl., and Vijaya Diagnost. Average management risk is noted at Indegene, Metropolis Healt, and Vimta Labs, while Suven Life Scie. has Below Average management risk. All peers exhibit Below Average growth, except for Vijaya Diagnost., which has Good growth, while the rest have Below Average growth.<BR><BR>Return Snapshot: Suven Life Scie. has the highest 1-year return at 84.49%, while Syngene Intl. has the lowest at -35.90%. Vijaya Diagnost.'s 1-year return of 50.91% is significantly higher than Syngene Intl.'s. Additionally, Syngene Intl. and Molbio Diagnosti show negative returns over the six-month period.

View full answer

How big is Vijaya Diagnost.?

01-Sep-2026

As of 31st August, Vijaya Diagnostic Centre Ltd has a market capitalization of ₹14,965.00 Cr, with recent net sales of ₹857.13 Cr and a net profit of ₹187.49 Cr.

As of 31st August, Vijaya Diagnostic Centre Ltd has a market capitalization of 14,965.00 Cr, categorizing it as a Small Cap company.<BR><BR>In the latest four quarters, Vijaya Diagnostic Centre Ltd reported Net Sales of 857.13 Cr and a Net Profit of 187.49 Cr.<BR><BR>The latest annual period for the balance sheet is March 2025, with Shareholder's Funds amounting to 795.71 Cr and Total Assets valued at 1,273.62 Cr.

View full answer

Should I buy, sell or hold Vijaya Diagnostic Centre Ltd?

13-Aug-2026

Are Vijaya Diagnostic Centre Ltd latest results good or bad?

08-May-2026

Vijaya Diagnostic Centre Ltd's latest results are strong, with a net profit increase of 37.49% year-on-year and revenue growth of 26.63%. However, the high P/E ratio of 77.0x raises concerns about sustainability, suggesting caution for potential investors.

Vijaya Diagnostic Centre Ltd's latest results for the quarter ending March 2026 indicate a strong performance overall. The company reported a net profit of ₹47.93 crores, which represents a significant year-on-year increase of 37.49% and an 11% increase compared to the previous quarter. Additionally, revenue reached ₹219.38 crores, marking a year-on-year growth of 26.63% and a sequential growth of 6.91%. <BR><BR>The operating margin also improved to 43.54%, the highest in seven quarters, reflecting effective cost management and operational efficiency. These metrics suggest that the company is experiencing robust demand and is effectively capitalizing on the growing healthcare awareness in India.<BR><BR>However, it's important to note that the stock is currently trading at a high valuation, with a P/E ratio of 77.0x, which is considered expensive compared to its peers. This premium valuation raises concerns about whether the company's growth can sustain such high expectations.<BR><BR>In summary, while the operational results are strong and indicate good financial health, the elevated valuation may warrant caution for potential investors.

View full answer

Is Vijaya Diagnost. technically bullish or bearish?

05-Dec-2025

As of December 4, 2025, the trend has shifted to mildly bullish, supported by bullish indicators like the MACD and Bollinger Bands, though caution is advised due to some lingering bearish signals.

As of 4 December 2025, the technical trend has changed from mildly bearish to mildly bullish. The current stance is mildly bullish, supported by a bullish MACD on the weekly chart and bullish Bollinger Bands on both weekly and monthly time frames. The daily moving averages also indicate a bullish trend. However, the monthly MACD and KST remain mildly bearish, suggesting some caution. The Dow Theory shows a mildly bullish stance on both weekly and monthly charts, while the On-Balance Volume is mildly bearish, indicating mixed signals. Overall, the strength of the bullish trend is tempered by some bearish indicators, but the shift to mildly bullish suggests potential for further upside.

View full answer

How has been the historical performance of Vijaya Diagnost.?

01-Dec-2025

Vijaya Diagnost has shown consistent growth over the past five years, with net sales increasing from 376.75 Cr in Mar'21 to 681.39 Cr in Mar'25, and profit after tax rising from 85.13 Cr to 143.79 Cr in the same period, indicating strong operational efficiency and financial performance.

Answer:<BR>The historical performance of Vijaya Diagnost shows a consistent growth trajectory in net sales and profitability over the past five years.<BR><BR>Breakdown:<BR>Vijaya Diagnost's net sales have increased from 376.75 Cr in Mar'21 to 681.39 Cr in Mar'25, reflecting a strong upward trend. Total operating income followed a similar pattern, rising to 681.39 Cr in Mar'25 from 459.22 Cr in Mar'23. The total expenditure, excluding depreciation, also grew, reaching 408.17 Cr in Mar'25, up from 210.77 Cr in Mar'21. Operating profit (PBDIT) saw a significant rise, reaching 291.54 Cr in Mar'25 compared to 177.83 Cr in Mar'21, indicating improved operational efficiency. Profit before tax increased to 193.16 Cr in Mar'25 from 112.12 Cr in Mar'21, while profit after tax rose to 143.79 Cr from 85.13 Cr in Mar'21. The earnings per share (EPS) also improved significantly, reaching 14.01 in Mar'25 from 3.68 in Mar'21. On the balance sheet, total assets grew to 1,273.62 Cr in Mar'25 from 480.68 Cr in Mar'20, while total liabilities increased to 1,273.62 Cr from 480.68 Cr in Mar'20, indicating a proportional growth in both assets and liabilities. Cash flow from operating activities improved to 224.00 Cr in Mar'25 from 106.00 Cr in Mar'20, although net cash outflow was recorded at -9.00 Cr in Mar'25. Overall, Vijaya Diagnost has demonstrated robust growth in sales, profits, and operational cash flow over the years.

View full answer

Who are the top shareholders of the Vijaya Diagnost.?

17-Jul-2025

The top shareholders of Vijaya Diagnost include promoters holding the majority, with Surendranath Reddy Sura as the largest individual shareholder at 32.3%. Mutual funds hold 23.55%, foreign institutional investors 19.56%, and the highest public shareholder is Nippon Life India Trustee Ltd at 5.82%.

The top shareholders of Vijaya Diagnost include a mix of promoters, mutual funds, and foreign institutional investors (FIIs). The majority of the shares are held by promoters, with Surendranath Reddy Sura being the largest individual shareholder, holding 32.3%. Mutual funds collectively hold 23.55% of the shares, while FIIs account for 19.56%. The highest public shareholder is Nippon Life India Trustee Ltd, which holds 5.82%. Additionally, individual investors have a stake of 3.24%.

View full answer

Is Vijaya Diagnost. overvalued or undervalued?

09-Jun-2025

As of August 1, 2022, Vijaya Diagnostics is considered very expensive and overvalued with a PE ratio of 69.56 and an EV to EBITDA of 36.94, trading at higher valuations than peers like Apollo Hospitals and Fortis Healthcare, despite outperforming the Sensex over the past year.

As of 1 August 2022, the valuation grade for Vijaya Diagnostics has moved from expensive to very expensive. The company is currently considered overvalued based on its high valuation metrics. Key ratios include a PE ratio of 69.56, an EV to EBITDA of 36.94, and a PEG ratio of 3.63, all of which indicate a premium valuation compared to its peers.<BR><BR>In comparison, Apollo Hospitals Enterprise Ltd. has a PE ratio of 69.03 and an EV to EBITDA of 34.71, while Fortis Healthcare Ltd. shows a PE ratio of 68.71 and an EV to EBITDA of 37.55. These comparisons highlight that Vijaya Diagnostics is trading at a higher valuation than its peers in the healthcare services sector. Although the stock has outperformed the Sensex over the past year with a return of 19.95% compared to the Sensex's 7.55%, the overall valuation suggests that the stock is not a favorable investment at this time.

View full answer

When is the next results date for Vijaya Diagnost.?

06-Jun-2025

No Upcoming Board Meetings

Has Vijaya Diagnost. declared dividend?

06-Jun-2025

Yes, Vijaya Diagnostic Centre Ltd has declared a 100% dividend of ₹1 per share, with an ex-date of August 30, 2024. While the company has shown varying price returns over different periods, dividend returns have been relatively low.

Yes, Vijaya Diagnostic Centre Ltd has declared a dividend.<BR><BR>Dividend Details:<BR>- Percentage announced: 100%<BR>- Amount per share: 1<BR>- Ex-date: 30 Aug 2024<BR><BR>Dividend Yield: 0.1%.<BR><BR>Total Returns by Period:<BR>In the 6 months period, the price return was -14.85%, the dividend return was 0%, resulting in a total return of -14.85%.<BR><BR>For the 1 year period, the price return was 19.05%, the dividend return was 0.12%, leading to a total return of 19.17%.<BR><BR>Over the 2 years period, the price return was 152.02%, the dividend return was 0.49%, which resulted in a total return of 152.51%.<BR><BR>In the 3 years period, the price return was 182.45%, the dividend return was 0.90%, culminating in a total return of 183.35%.<BR><BR>For the 4 years period, both the price return and dividend return were 0%, resulting in a total return of 0.0%.<BR><BR>In the 5 years period, there was also no change in price or dividend return, leading to a total return of 0.0%.<BR><BR>Overall, while Vijaya Diagnostic Centre Ltd has declared a dividend, the dividend returns over various periods have been relatively low compared to the price returns, indicating that while there is a dividend, the company's performance has varied significantly over time.

View full answer
iScoreScore
Click here to find our call on this stock
Strong Sell
Sell
Hold
Buy
Strong Buy

Dashboard

1

High Management Efficiency with a high ROCE of 22.48%

 
2

Company has a Debt to Equity ratio (avg) of 0.09 times

 
3

The company has declared Positive results for the last 3 consecutive quarters

4

High Institutional Holdings at 43.26%

5

Consistent Returns over the last 3 years

stock-summaryMojo Parameters

Mojo Parameters

Loading Valuation Snapshot...

Stock DNA

stock-summary
Industry

Healthcare Services

stock-summary
Market cap

INR 15,604 Cr (Small Cap)

stock-summary
P/E

83.00

stock-summary
Industry P/E

NA

stock-summary
Dividend Yield

0.00%

stock-summary
Debt Equity

0.15

stock-summary
Return on Equity

18.07%

stock-summary
Price to Book

16.17

Revenue and Profits:
Net Sales:
231 Cr
(Quarterly Results - Jun 2026)
Net Profit:
53 Cr
stock-summaryTotal Returns
Total Returns (Price + Dividend) stock-summary
Dividend Yield (0%)
TimePeriod
Price Return
Dividend Return
Total Return
3 Months
16.61%
0.16%
16.77%
6 Months
60.06%
0.22%
60.28%
1 Year
39.84%
0.19%
40.03%
2 Years
64.75%
0.44%
65.19%
3 Years
212.34%
1.09%
213.43%
4 Years
240.03%
1.30%
241.33%
5 Years
0%
1.21%
1.21%

Latest dividend: 2 per share ex-dividend date: Aug-29-2025

Risk Adjusted Returns v/s stock-summary
Returns Beta
Icon
Beta has not been calculated since enough price history is not available
stock-summaryNews & Corporate Actions

Announcements stock-summary

Announcement under Regulation 30 (LODR)-Analyst / Investor Meet - Intimation

02-Sep-2026 | Source : BSE

Institutional Investor Meeting hosted by Emkay Global.

Announcement under Regulation 30 (LODR)-Change in Management

02-Sep-2026 | Source : BSE

Appointment of Chief Information Officer (CIO)

Announcement under Regulation 30 (LODR)-Newspaper Publication

27-Aug-2026 | Source : BSE

Intimation of 24th AGM - Post Dispatch Newspaper Advertisement

Corporate Actions stock-summary

stock-summary
BOARD MEETING

No Upcoming Board Meetings

stock-summary
DIVIDEND

Vijaya Diagnostic Centre Ltd has declared 200% dividend, ex-date: 16 Sep 26

stock-summary
SPLITS

No Splits history available

stock-summary
BONUS

No Bonus history available

stock-summary
RIGHTS

No Rights history available

stock-summaryKey Factors

Quality key factors stock-summary

Factor
Value
Sales Growth (5y)
13.87%
EBIT Growth (5y)
10.94%
EBIT to Interest (avg)
7.08
Debt to EBITDA (avg)
1.16
Net Debt to Equity (avg)
0.15
Sales to Capital Employed (avg)
0.63
Tax Ratio
25.43%
Dividend Payout Ratio
14.35%
Pledged Shares
1.96%
Institutional Holding
43.26%
ROCE (avg)
26.74%
ROE (avg)
17.49%

Valuation key factors

Factor
Value
P/E Ratio
83
Industry P/E
0
Price to Book Value
16.16
EV to EBIT
58.72
EV to EBITDA
43.14
EV to Capital Employed
14.21
EV to Sales
18.22
PEG Ratio
3.53
Dividend Yield
NA
ROCE (Latest)
22.31%
ROE (Latest)
18.07%

Technicals key factors

Indicator
Weekly
Monthly
MACD
Bullish
Bullish
RSI
No Signal
No Signal
Bollinger Bands
Bullish
Mildly Bullish
Moving Averages
Bullish (Daily)
KST
Mildly Bearish
Bullish
Dow Theory
No Trend
No Trend
OBV
No Trend
No Trend
stock-summary Technical Indicator Scale: Bearish, Mildly Bearish, Sideways, Mildly Bullish, Bullish  Turned 
stock-summaryShareholding
Shareholding Snapshot : Jun 2026stock-summary
Shareholding Compare (%holding) stock-summary
Majority shareholders

Promoters

Pledged Promoter Holdings

1.9618

Mutual Funds

Held by 26 Schemes (30.66%)

FIIs

Held by 132 FIIs (11.66%)

Promoter with highest holding

Surendranath Reddy Sura (32.23%)

Highest Public shareholder

Kotak Small Cap Fund (6.59%)

Individual Investors Holdings

3.49%

stock-summaryFinancial
[
  {
    "link": "quarterly",
    "btn_text": "All Quarterly Results",
    "header": "Quarterly Results Snapshot (Consolidated) - Jun'26 - QoQ",
    "rhs": [
      {
        "prefix": "Net Sales ",
        "suffix": "QoQ Growth in quarter ended Jun 2026 is 5.29% vs 6.91% in Mar 2026",
        "dir": -1
      },
      {
        "prefix": "Consolidated Net Profit ",
        "suffix": "QoQ Growth in quarter ended Jun 2026 is 10.79% vs 11.00% in Mar 2026",
        "dir": -1
      }
    ],
    "table": {
      "header": [
        "Jun'26",
        "Mar'26",
        "Change(%)"
      ],
      "body": [
        {
          "field": "Net Sales",
          "val1": "230.98",
          "val2": "219.38",
          "chgp": "5.29%",
          "chgp_class": "positive"
        },
        {
          "field": "Operating Profit (PBDIT) excl Other Income",
          "val1": "98.54",
          "val2": "95.52",
          "chgp": "3.16%",
          "chgp_class": "positive"
        },
        {
          "field": "Interest",
          "val1": "11.00",
          "val2": "9.32",
          "chgp": "18.03%",
          "chgp_class": "negative"
        },
        {
          "field": "Exceptional Items",
          "val1": "0.00",
          "val2": "0.00",
          "chgp": "",
          "chgp_class": "neutral"
        },
        {
          "field": "Consolidate Net Profit",
          "val1": "53.10",
          "val2": "47.93",
          "chgp": "10.79%",
          "chgp_class": "positive"
        },
        {
          "field": "Operating Profit Margin (Excl OI)",
          "val1": "42.66%",
          "val2": "43.54%",
          "chgp": "-0.88%",
          "chgp_class": "negative"
        }
      ]
    }
  },
  {
    "link": "half-yearly",
    "btn_text": "All Half Yearly Results",
    "header": "Half Yearly Results Snapshot (Consolidated) - Sep'25",
    "rhs": [
      {
        "prefix": "Net Sales ",
        "suffix": " Growth in half year ended Sep 2025 is 14.87% vs 30.50% in Sep 2024",
        "dir": -1
      },
      {
        "prefix": "Consolidated Net Profit ",
        "suffix": " Growth in half year ended Sep 2025 is 11.19% vs 23.69% in Sep 2024",
        "dir": -1
      }
    ],
    "table": {
      "header": [
        "Sep'25",
        "Sep'24",
        "Change(%)"
      ],
      "body": [
        {
          "field": "Net Sales",
          "val1": "389.61",
          "val2": "339.17",
          "chgp": "14.87%",
          "chgp_class": "positive"
        },
        {
          "field": "Operating Profit (PBDIT) excl Other Income",
          "val1": "155.36",
          "val2": "137.22",
          "chgp": "13.22%",
          "chgp_class": "positive"
        },
        {
          "field": "Interest",
          "val1": "15.31",
          "val2": "12.73",
          "chgp": "20.27%",
          "chgp_class": "negative"
        },
        {
          "field": "Exceptional Items",
          "val1": "0.00",
          "val2": "0.00",
          "chgp": "",
          "chgp_class": "neutral"
        },
        {
          "field": "Consolidate Net Profit",
          "val1": "81.87",
          "val2": "73.63",
          "chgp": "11.19%",
          "chgp_class": "positive"
        },
        {
          "field": "Operating Profit Margin (Excl OI)",
          "val1": "39.88%",
          "val2": "40.46%",
          "chgp": "-0.58%",
          "chgp_class": "negative"
        }
      ]
    }
  },
  {
    "link": "nine-monthly",
    "btn_text": "All Nine Monthly Results",
    "header": "Nine Monthly Results Snapshot (Consolidated) - Dec'25",
    "rhs": [
      {
        "prefix": "Net Sales ",
        "suffix": "YoY Growth in nine months ended Dec 2025 is 17.06% vs 29.43% in Dec 2024",
        "dir": -1
      },
      {
        "prefix": "Consolidated Net Profit ",
        "suffix": "YoY Growth in nine months ended Dec 2025 is 14.95% vs 27.42% in Dec 2024",
        "dir": -1
      }
    ],
    "table": {
      "header": [
        "Dec'25",
        "Dec'24",
        "Change(%)"
      ],
      "body": [
        {
          "field": "Net Sales",
          "val1": "594.82",
          "val2": "508.15",
          "chgp": "17.06%",
          "chgp_class": "positive"
        },
        {
          "field": "Operating Profit (PBDIT) excl Other Income",
          "val1": "241.42",
          "val2": "204.34",
          "chgp": "18.15%",
          "chgp_class": "positive"
        },
        {
          "field": "Interest",
          "val1": "23.90",
          "val2": "19.55",
          "chgp": "22.25%",
          "chgp_class": "negative"
        },
        {
          "field": "Exceptional Items",
          "val1": "0.00",
          "val2": "0.00",
          "chgp": "",
          "chgp_class": "neutral"
        },
        {
          "field": "Consolidate Net Profit",
          "val1": "125.05",
          "val2": "108.79",
          "chgp": "14.95%",
          "chgp_class": "positive"
        },
        {
          "field": "Operating Profit Margin (Excl OI)",
          "val1": "40.59%",
          "val2": "40.21%",
          "chgp": "0.38%",
          "chgp_class": "positive"
        }
      ]
    }
  },
  {
    "link": "annual",
    "btn_text": "All Annual Results",
    "header": "Annual Results Snapshot (Consolidated) - Mar'26",
    "rhs": [
      {
        "prefix": "Net Sales ",
        "suffix": "YoY Growth in year ended Mar 2026 is 19.49% vs 24.38% in Mar 2025",
        "dir": -1
      },
      {
        "prefix": "Consolidated Net Profit ",
        "suffix": "YoY Growth in year ended Mar 2026 is 20.30% vs 21.00% in Mar 2025",
        "dir": -1
      }
    ],
    "table": {
      "header": [
        "Mar'26",
        "Mar'25",
        "Change(%)"
      ],
      "body": [
        {
          "field": "Net Sales",
          "val1": "814.20",
          "val2": "681.39",
          "chgp": "19.49%",
          "chgp_class": "positive"
        },
        {
          "field": "Operating Profit (PBDIT) excl Other Income",
          "val1": "336.93",
          "val2": "273.22",
          "chgp": "23.32%",
          "chgp_class": "positive"
        },
        {
          "field": "Interest",
          "val1": "33.23",
          "val2": "26.74",
          "chgp": "24.27%",
          "chgp_class": "negative"
        },
        {
          "field": "Exceptional Items",
          "val1": "0.00",
          "val2": "-1.03",
          "chgp": "100.00%",
          "chgp_class": "positive"
        },
        {
          "field": "Consolidate Net Profit",
          "val1": "172.98",
          "val2": "143.79",
          "chgp": "20.30%",
          "chgp_class": "positive"
        },
        {
          "field": "Operating Profit Margin (Excl OI)",
          "val1": "41.38%",
          "val2": "40.10%",
          "chgp": "1.28%",
          "chgp_class": "positive"
        }
      ]
    }
  }
]

Quarterly Results Snapshot (Consolidated) - Jun'26 - QoQstock-summary

Jun'26
Mar'26
Change(%)
Net Sales
230.98
219.38
5.29%
Operating Profit (PBDIT) excl Other Income
98.54
95.52
3.16%
Interest
11.00
9.32
18.03%
Exceptional Items
0.00
0.00
Consolidate Net Profit
53.10
47.93
10.79%
Operating Profit Margin (Excl OI)
42.66%
43.54%
-0.88%
Values in Rs Cr.
Direction Arrows
Net Sales

QoQ Growth in quarter ended Jun 2026 is 5.29% vs 6.91% in Mar 2026

Direction Arrows
Consolidated Net Profit

QoQ Growth in quarter ended Jun 2026 is 10.79% vs 11.00% in Mar 2026

Half Yearly Results Snapshot (Consolidated) - Sep'25stock-summary

Sep'25
Sep'24
Change(%)
Net Sales
389.61
339.17
14.87%
Operating Profit (PBDIT) excl Other Income
155.36
137.22
13.22%
Interest
15.31
12.73
20.27%
Exceptional Items
0.00
0.00
Consolidate Net Profit
81.87
73.63
11.19%
Operating Profit Margin (Excl OI)
39.88%
40.46%
-0.58%
Values in Rs Cr.
Direction Arrows
Net Sales

Growth in half year ended Sep 2025 is 14.87% vs 30.50% in Sep 2024

Direction Arrows
Consolidated Net Profit

Growth in half year ended Sep 2025 is 11.19% vs 23.69% in Sep 2024

Nine Monthly Results Snapshot (Consolidated) - Dec'25stock-summary

Dec'25
Dec'24
Change(%)
Net Sales
594.82
508.15
17.06%
Operating Profit (PBDIT) excl Other Income
241.42
204.34
18.15%
Interest
23.90
19.55
22.25%
Exceptional Items
0.00
0.00
Consolidate Net Profit
125.05
108.79
14.95%
Operating Profit Margin (Excl OI)
40.59%
40.21%
0.38%
Values in Rs Cr.
Direction Arrows
Net Sales

YoY Growth in nine months ended Dec 2025 is 17.06% vs 29.43% in Dec 2024

Direction Arrows
Consolidated Net Profit

YoY Growth in nine months ended Dec 2025 is 14.95% vs 27.42% in Dec 2024

Annual Results Snapshot (Consolidated) - Mar'26stock-summary

Mar'26
Mar'25
Change(%)
Net Sales
814.20
681.39
19.49%
Operating Profit (PBDIT) excl Other Income
336.93
273.22
23.32%
Interest
33.23
26.74
24.27%
Exceptional Items
0.00
-1.03
100.00%
Consolidate Net Profit
172.98
143.79
20.30%
Operating Profit Margin (Excl OI)
41.38%
40.10%
1.28%
Values in Rs Cr.
Direction Arrows
Net Sales

YoY Growth in year ended Mar 2026 is 19.49% vs 24.38% in Mar 2025

Direction Arrows
Consolidated Net Profit

YoY Growth in year ended Mar 2026 is 20.30% vs 21.00% in Mar 2025

stock-summaryCompany CV
About Vijaya Diagnostic Centre Ltd stock-summary
stock-summary
Vijaya Diagnostic Centre Ltd
Small Cap
Healthcare Services
Vijaya Diagnostic Centre Limited established in 1981, is a leading provider of diagnostic services in India. With a steadfast commitment to delivering high quality, comprehensive diagnostic solutions, Vijaya has grown into the largest integrated diagnostic chain in Southern India. Founded by Dr. S. Surendranath Reddy, the journey began to offer reliable and comprehensive diagnostic services under one roof.
Company Coordinates stock-summary
Icon
No Company Details Available