
Compare Vikram Thermo with Similar Stocks
Dashboard
Company has a Debt to Equity ratio (avg) of 0.01 times
Poor long term growth as Net Sales has grown by an annual rate of 12.91% over the last 5 years
Flat results in Mar 26
With ROE of 28, it has a Very Expensive valuation with a 4.4 Price to Book Value
Despite the size of the company, domestic mutual funds hold only 0% of the company
Market Beating performance in long term as well as near term
Stock DNA
Commodity Chemicals
INR 588 Cr (Micro Cap)
16.00
41
0.54%
-0.06
28.04%
4.22
Total Returns (Price + Dividend) 
Latest dividend: 1 per share ex-dividend date: Sep-19-2025
Risk Adjusted Returns v/s
Returns Beta

News

Vikram Thermo (India) Ltd Upgraded to Hold on Technical Improvements and Market Performance
Vikram Thermo (India) Ltd has seen its investment rating upgraded from Sell to Hold, reflecting a notable shift in its technical outlook and sustained market outperformance despite flat recent financial results. The upgrade, effective from 10 June 2026, is driven primarily by improved technical indicators, steady long-term returns, and a stable financial position, although valuation concerns and muted sales growth temper enthusiasm.
Read full news article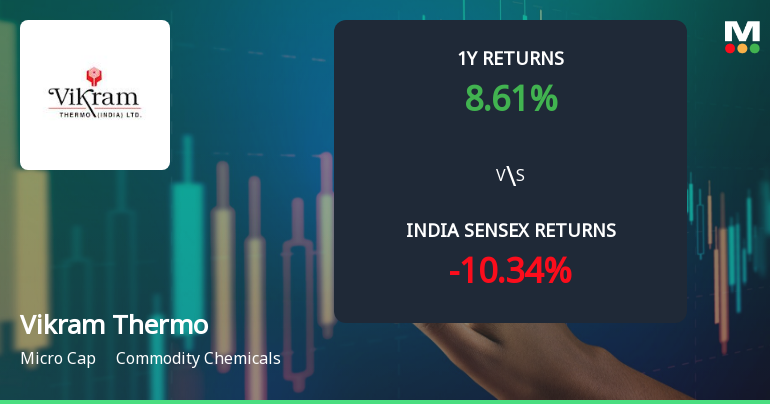
Vikram Thermo (India) Ltd Sees Shift in Price Momentum Amid Mixed Technical Signals
Vikram Thermo (India) Ltd, a micro-cap player in the commodity chemicals sector, has experienced a notable shift in its technical parameters, reflecting a complex interplay of bullish and bearish signals. Despite a recent downgrade from Hold to Sell by MarketsMOJO, the stock’s price momentum and technical indicators reveal a nuanced picture that investors should carefully analyse.
Read full news article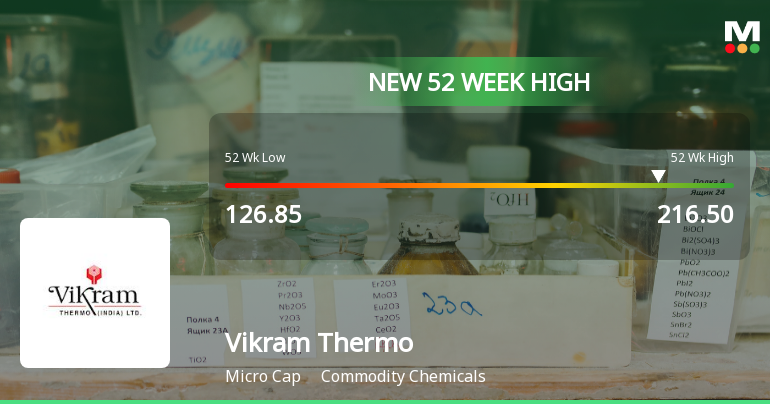
Broad-Based Technical Strength Lifts Vikram Thermo (India) Ltd to 52-Week High of Rs 216.5
Surging to a fresh 52-week high of Rs 216.5 on 8 Jun 2026, Vikram Thermo (India) Ltd has demonstrated remarkable price momentum, outperforming its sector and the broader market despite a bearish backdrop for the Sensex. This milestone caps a three-day rally that has delivered nearly 20% returns, underscoring the stock’s strong technical positioning.
Read full news article Announcements
Announcement under Regulation 30 (LODR)-Newspaper Publication
27-May-2026 | Source : BSEPlease find enclosed herewith copy of advertisement given in newspaper of audited financial results for the quarter and year ended on 31 March 2026.
Board Meeting Outcome for COMPLIANCE OF REGULATION 30 OF SEBI (LISTING OBLIGATIONS AND DISCLOSURES REQUIREMENTS) REGULATIONS 2015 FOR M/S. VIKRAM THERMO (INDIA) LIMITED.
26-May-2026 | Source : BSEWith regard to captioned subject we would like to inform you that Board meeting of the Company was held today on 26th May 2026 at the Registered Office of the Company wherein following business were transacted
COMPLIANCE OF REGULATION 33 OF SECURITIES AND EXCHANGE BOARD OF INDIA (LISTING OBLIGATIONS AND DISCLOSURES REQUIREMENTS) REGULATIONS 2015
26-May-2026 | Source : BSEThe board of directors of the company at meeting held on 26-05-2026 has considered and approved the audited financial results for the quarter and year ended on 31 March 2026.
Corporate Actions

No Upcoming Board Meetings

Vikram Thermo (India) Ltd has declared 10% dividend, ex-date: 19 Sep 25

No Splits history available

Vikram Thermo (India) Ltd has announced 4:1 bonus issue, ex-date: 12 May 22

No Rights history available
Quality key factors
Valuation key factors
Technicals key factors
 Technical Indicator Scale: Bearish, Mildly Bearish, Sideways, Mildly Bullish, Bullish Turned
 Shareholding Snapshot : Mar 2026
Shareholding Compare (%holding)
Promoters
None
Held by 0 Schemes
Held by 0 FIIs
Dhirajlal Karsanbhai Patel (18.5%)
Basava Sankararao Kolli (2.27%)
28.05%
Quarterly Results Snapshot (Standalone) - Mar'26 - QoQ

QoQ Growth in quarter ended Mar 2026 is 11.02% vs -1.79% in Dec 2025

QoQ Growth in quarter ended Mar 2026 is -22.26% vs -1.08% in Dec 2025
Half Yearly Results Snapshot (Standalone) - Sep'25
Growth in half year ended Sep 2025 is -2.41% vs 2.24% in Sep 2024
Growth in half year ended Sep 2025 is 414.38% vs -143.18% in Sep 2024
Nine Monthly Results Snapshot (Standalone) - Dec'25
YoY Growth in nine months ended Dec 2025 is -1.88% vs 12.98% in Dec 2024
YoY Growth in nine months ended Dec 2025 is 909.43% vs -85.48% in Dec 2024
Annual Results Snapshot (Standalone) - Mar'26
YoY Growth in year ended Mar 2026 is 6.23% vs 24.65% in Mar 2025
YoY Growth in year ended Mar 2026 is 375.31% vs -68.09% in Mar 2025
About Vikram Thermo (India) Ltd

Company Coordinates


