
Compare Vinati Organics with Similar Stocks
Stock DNA
Specialty Chemicals
INR 14,242 Cr (Small Cap)
32.00
18
0.54%
-0.06
14.04%
4.55
Total Returns (Price + Dividend) 
Latest dividend: 7.5 per share ex-dividend date: Sep-19-2025
Risk Adjusted Returns v/s
Returns Beta

News
Vinati Organics Ltd is Rated Sell
Vinati Organics Ltd is rated 'Sell' by MarketsMOJO, with this rating last updated on 06 Oct 2025. However, the analysis and financial metrics discussed here reflect the stock's current position as of 24 June 2026, providing investors with an up-to-date view of the company’s fundamentals, returns, and market performance.
Read full news article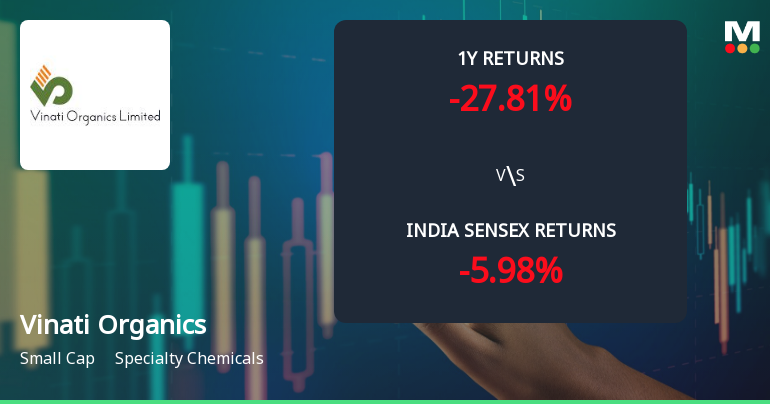
Vinati Organics Ltd Technical Momentum Shifts Amid Mixed Market Signals
Vinati Organics Ltd, a specialty chemicals company, has experienced a notable shift in its technical momentum, reflecting a complex interplay of bullish and bearish signals. Despite a recent 3.98% intraday gain, the stock’s overall technical indicators suggest a cautious outlook, with a downgrade in its Mojo Grade from Hold to Sell on 6 October 2025.
Read full news article
Vinati Organics Ltd Faces Bearish Momentum Amid Technical Downgrade
Vinati Organics Ltd, a specialty chemicals company, has seen a notable shift in its technical momentum, with key indicators signalling a bearish trend. The stock’s recent downgrade from a Hold to a Sell rating by MarketsMOJO, accompanied by a drop in its Mojo Score to 37.0, reflects growing concerns over its price momentum and technical health amid a challenging market backdrop.
Read full news article Announcements
Announcement under Regulation 30 (LODR)-Analyst / Investor Meet - Intimation
18-Jun-2026 | Source : BSEIntimation of Schedule of Analysts/Institutional Investor Meeting
Announcement under Regulation 30 (LODR)-Analyst / Investor Meet - Intimation
17-Jun-2026 | Source : BSEIntimation of Schedule of Analysts/Institutional Investor Meeting
Communication To Shareholders - Intimation On Dividend Taxation Provisions
15-Jun-2026 | Source : BSECommunication to Shareholders- intimation on dividend Taxation provisions
Corporate Actions

No Upcoming Board Meetings

Vinati Organics Ltd has declared 750% dividend, ex-date: 19 Sep 25

Vinati Organics Ltd has announced 1:2 stock split, ex-date: 05 Feb 20

Vinati Organics Ltd has announced 1:2 bonus issue, ex-date: 22 Nov 07

No Rights history available
Quality key factors
Valuation key factors
Technicals key factors
 Technical Indicator Scale: Bearish, Mildly Bearish, Sideways, Mildly Bullish, Bullish Turned
 Shareholding Snapshot : Mar 2026
Shareholding Compare (%holding)
Promoters
None
Held by 12 Schemes (9.05%)
Held by 99 FIIs (3.72%)
Sub-total (a)(1) (74.28%)
Canara Robeco Mutual Fund A/c Canara Robeco Multi Cap Fund (2.99%)
9.67%
Quarterly Results Snapshot (Consolidated) - Mar'26 - QoQ

QoQ Growth in quarter ended Mar 2026 is 13.78% vs -3.53% in Dec 2025
QoQ Growth in quarter ended Mar 2026 is 22.84% vs -12.23% in Dec 2025
Half Yearly Results Snapshot (Consolidated) - Sep'25

Growth in half year ended Sep 2025 is 1.31% vs 19.56% in Sep 2024
Growth in half year ended Sep 2025 is 16.21% vs 32.88% in Sep 2024
Nine Monthly Results Snapshot (Consolidated) - Dec'25
YoY Growth in nine months ended Dec 2025 is 1.45% vs 18.53% in Dec 2024
YoY Growth in nine months ended Dec 2025 is 13.36% vs 28.98% in Dec 2024
Annual Results Snapshot (Consolidated) - Mar'26
YoY Growth in year ended Mar 2026 is -0.95% vs 18.33% in Mar 2025
YoY Growth in year ended Mar 2026 is 9.50% vs 25.47% in Mar 2025
About Vinati Organics Ltd

Company Coordinates


