Vineet Laborator

  • Market Cap: Micro Cap
  • Industry: Pharmaceuticals & Biotechnology
  • ISIN: INE505Y01010
  • NSEID: VINEETLAB
  • BSEID: 543298
INR
37.58
0.37 (0.99%)
BSENSE

Sep 09, 11:01 AM

BSE+NSE Vol: 40.64 k

  • Price Points
  • Score
  • Mojo Parameters
  • Total Return
  • News and Corporate Actions
  • Key factors
  • Shareholding
  • Financials
  • CompanyCV
stock-summaryPrice Point
High/Low

1Day

52 Week

Valuation
Technical
Day's Volume

CASH

40.64 k (132.08%) Volume

Shareholding (Jun 2026)

FII

0.50%

Held by 1 FIIs

DII

0.00%

Held by 0 DIIs

Promoter

5.98%

Why is Vineet Laboratories Ltd falling/rising?

06-Sep-2026

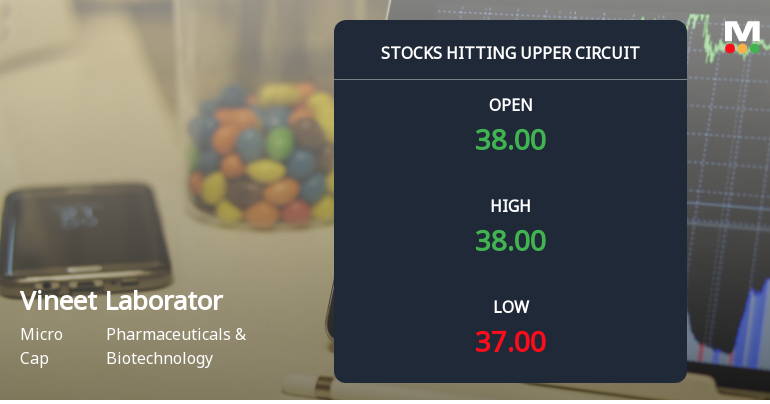
As of 05-Sep, Vineet Laboratories Ltd's stock price is stable at 38.00, but investor participation has declined significantly, indicating waning interest. Despite a strong annual return of 32.96%, the company faces challenges with weak fundamentals and recent financial performance, suggesting a cautious outlook on the stock.

As of 05-Sep, Vineet Laboratories Ltd's stock price is currently stable at 38.00, showing no change (0.00%). Despite this stability, the stock has experienced a decline in investor participation, with delivery volume falling by 67.39% against the 5-day average. This decrease in trading activity may indicate waning interest among investors, which could contribute to a perception of weakness in the stock.<BR><BR>Over the past year, the stock has performed well, generating a return of 32.96%, significantly outperforming the broader market, which has seen a return of only 1.51%. However, the company faces challenges, including a weak long-term fundamental strength, as evidenced by a -14.27% CAGR growth in operating profits over the last five years and a high Debt to EBITDA ratio of -3.67 times, indicating difficulties in servicing debt.<BR><BR>Additionally, the company's recent financial results show flat performance, with net sales and profit after tax both declining by 33.50% in the last nine months. The inventory turnover ratio is also concerning, being the lowest at 1.01 times. While the stock is trading at a discount compared to its peers' average historical valuations, the overall financial health and profitability metrics, such as a return on equity of only 5.08%, suggest that the stock may not be a strong buy at this time.<BR><BR>In summary, while Vineet Laboratories Ltd has shown impressive returns over the past year, the combination of declining investor participation, weak long-term fundamentals, and poor recent financial performance may contribute to a cautious outlook on the stock's future movements.

View full answer

Who are in the management team of Vineet Laborator?

01-Sep-2026

The management team of Vineet Laborator includes Gaddam Venkata Ramana (Managing Director), Bhupathiraju S Raju (Whole Time Director & CFO), Kandula Murali Mohan (Non Executive Director), Dilip V Acharekar and K. Bhaskar Reddy (Independent Directors), Nirosha Ravikanti (Company Secretary), Yerukalapudi Hari Priya (Additional Director), and Rameshkumar Bandari (Company Secretary & Compliance Officer).

The management team of Vineet Laborator includes the following individuals:<BR><BR>1. **Gaddam Venkata Ramana** - Managing Director<BR>2. **Bhupathiraju S Raju** - Whole Time Director & CFO<BR>3. **Kandula Murali Mohan** - Non Executive Director<BR>4. **Dilip V Acharekar** - Independent Director<BR>5. **K. Bhaskar Reddy** - Independent Director<BR>6. **Nirosha Ravikanti** - Company Secretary<BR>7. **Yerukalapudi Hari Priya** - Additional Director<BR>8. **Rameshkumar Bandari** - Company Secretary & Compliance Officer<BR><BR>If you have any more questions about Vineet Laborator or its management, feel free to ask!

View full answer

What does Vineet Laborator do?

01-Sep-2026

Vineet Laboratories Ltd is a micro-cap manufacturing company that produces intermediates for active pharmaceutical ingredients. As of March 2026, it reported net sales of 19 Cr and a net profit of 1 Cr.

Overview: <BR>Vineet Laboratories Ltd is a manufacturing company that produces intermediates essential for the manufacture of active pharmaceutical ingredients, operating within the Pharmaceuticals & Biotechnology industry and classified as a Micro Cap.<BR><BR>History: <BR>Vineet Laboratories Limited, formerly known as Ortin Laboratories Limited, was incorporated on 10 November 2016. The latest quarterly results reported net sales and net profit for the period ending March 2026.<BR><BR>Financial Snapshot: <BR>Net Sales: 19 Cr (Quarterly Results - Mar 2026) <BR>Net Profit: 1 Cr (Quarterly Results - Mar 2026) <BR>Market Cap: INR 77 Cr (Micro Cap)<BR><BR>Key Metrics: <BR>P/E: 68.00 <BR>Industry P/E: 37 <BR>Dividend Yield: 0.00% <BR>Debt-Equity: 2.96 <BR>Return on Equity: 7.81% <BR>Price to Book: 5.30 <BR><BR>Contact Details: <BR>Address: SyNo 11/A3 Saheb Nagar KurduVi, Chintal Kunta Eshwaramma LB Nr Hyderabad Telangana : 500074 <BR>Tel: 91-40-24128833 <BR>Email: cs@vineetlabs.co.in <BR>Website: http://www.vineetlaboratories.com

View full answer

Who are the peers of the Vineet Laborator?

01-Sep-2026

Vineet Laborator's peers include Asston Pharmaceu, Amwill Health, Sunil Healthcare, and others, with varying management risks and growth rates. Vineet Laborator has a 1-year return of 39.69%, outperforming peers like Asston Pharmaceu (25.54%) and Bharat Immunolog (-27.90%).

Peers: The peers of Vineet Laborator are Asston Pharmaceu, Amwill Health, Sunil Healthcare, Samrat Pharma, Source Natural, Bharat Immunolog, Zenith Drugs, Onyx Biotec, Ajooni Biotech, and Vilin Bio Med.<BR><BR>Quality Snapshot: Excellent management risk is observed at Amwill Health, while Average management risk is found at Asston Pharmaceu, Samrat Pharma, and Onyx Biotec, and the rest. Good management risk is noted at Source Natural, while Below Average management risk is seen at Vineet Laborator, Sunil Healthcare, Bharat Immunolog, Zenith Drugs, Ajooni Biotech, and Vilin Bio Med. Growth is Excellent at Amwill Health, Good at Sunil Healthcare and Ajooni Biotech, Average at Amwill Health and the rest, and Below Average at Vineet Laborator, Asston Pharmaceu, Samrat Pharma, Source Natural, Bharat Immunolog, Zenith Drugs, and Onyx Biotec. Capital Structure is Excellent at Samrat Pharma, Good at Source Natural and Ajooni Biotech, Average at Asston Pharmaceu and Onyx Biotec, and Below Average at Vineet Laborator, Sunil Healthcare, Bharat Immunolog, Zenith Drugs, and Vilin Bio Med.<BR><BR>Return Snapshot: The peer with the highest 1-year return is Asston Pharmaceu at 25.54%, while the peer with the lowest is Bharat Immunolog at -27.90%. Vineet Laborator's 1-year return is 39.69%, which is higher than both of these peers. Additionally, Samrat Pharma, Bharat Immunolog, and Zenith Drugs have negative six-month returns.

View full answer

How big is Vineet Laborator?

01-Sep-2026

As of 31st August, Vineet Laboratories Ltd has a market capitalization of 77.00 Cr, with recent net sales of 59.40 Cr and a net profit of 1.11 Cr. The balance sheet for March 2025 shows shareholder's funds of 14.65 Cr and total assets of 94.54 Cr.

As of 31st August, Vineet Laboratories Ltd has a market capitalization of 77.00 Cr, categorizing it as a Micro Cap company.<BR><BR>In the latest 4 quarters, Vineet Laboratories reported Net Sales of 59.40 Cr and a Net Profit of 1.11 Cr.<BR><BR>The latest annual period for the balance sheet is March 2025, showing Shareholder's Funds of 14.65 Cr and Total Assets of 94.54 Cr.

View full answer

Should I buy, sell or hold Vineet Laboratories Ltd?

26-Aug-2026

When is the next results date for Vineet Laboratories Ltd?

21-Aug-2026

The next results date for Vineet Laboratories Ltd is August 25, 2026.

The next results date for Vineet Laboratories Ltd is scheduled for August 25, 2026.

View full answer

Are Vineet Laborator latest results good or bad?

09-Nov-2025

Vineet Laboratories' latest results show a mixed performance: while the company achieved a net profit of ₹0.40 crore and improved operating margins, it faced an 8.12% year-on-year revenue decline and significant financial challenges, including a negative return on equity and high debt levels, indicating caution for investors.

The latest results for Vineet Laboratories present a mixed picture. On the positive side, the company reported a net profit of ₹0.40 crore in Q2 FY26, a significant turnaround from a loss of ₹0.87 crore in the previous quarter. Additionally, the operating margin improved dramatically to 18.25%, up from just 4.30% in Q1 FY26, indicating some operational efficiency gains.<BR><BR>However, there are significant concerns. Revenue for the quarter was ₹17.42 crore, which represents an 8.12% decline year-on-year, continuing a troubling trend of decreasing sales. This follows an even steeper drop of 68.82% in the previous quarter. The company's financial health is also worrying, with a return on equity that has plummeted to -137.05%, indicating severe capital inefficiency.<BR><BR>Moreover, the company has faced substantial operational challenges, including a sharp decline in shareholder funds and high financial leverage, with a debt-to-equity ratio of 2.82. The recent reduction in promoter shareholding from 35.85% to 15.89% raises red flags about insider confidence in the company's future.<BR><BR>In summary, while there are some positive signs in terms of profitability and margin recovery, the overall financial performance, particularly the declining revenues and structural challenges, suggest that the results are more concerning than encouraging. Investors should approach with caution given the broader issues at play.

View full answer

How has been the historical performance of Vineet Laborator?

09-Nov-2025

Vineet Laborator has experienced a significant decline in financial performance, with net sales dropping from 243.48 Cr in March 2021 to 75.00 Cr in March 2025, resulting in a loss of 20.19 Cr after tax. Despite a slight recovery in cash flow from operating activities, the overall financial position remains weak.

Answer:<BR>The historical performance of Vineet Laborator shows a significant decline in key financial metrics over the past few years, culminating in a challenging fiscal year ending March 2025.<BR><BR>Breakdown:<BR>Vineet Laborator's net sales have decreased from 243.48 Cr in March 2021 to just 75.00 Cr in March 2025, reflecting a downward trend in revenue. The total operating income followed a similar pattern, dropping from 243.48 Cr in March 2021 to 75.00 Cr in March 2025. The company's total expenditure, excluding depreciation, also decreased from 235.33 Cr in March 2021 to 91.28 Cr in March 2025, yet the operating profit (PBDIT) turned negative, showing a loss of 16.28 Cr in March 2025 compared to a profit of 8.15 Cr in March 2021. This resulted in a profit before tax of -20.78 Cr in March 2025, down from 4.06 Cr in March 2021, and a profit after tax of -20.19 Cr, contrasting with a profit of 1.78 Cr in March 2021. The company's total liabilities decreased from 108.74 Cr in March 2021 to 94.54 Cr in March 2025, while total assets also fell from 108.74 Cr to 94.54 Cr in the same period. Cash flow from operating activities showed a positive cash flow of 11.00 Cr in March 2025, a recovery from negative cash flows in previous years, but the overall cash position remained weak with no cash equivalents reported at the end of March 2025.

View full answer

Who are the top shareholders of the Vineet Laborator?

17-Jul-2025

The top shareholders of Vineet Laborator are Venkata Ramana Gaddam, the promoter with 9.01%, and Rajesh Poddar, the highest public shareholder with 4.48%. Individual investors hold a combined 58.67%, with no institutional or pledged promoter holdings.

The top shareholders of Vineet Laborator include Venkata Ramana Gaddam, who is the promoter with the highest holding at 9.01%. The highest public shareholder is Rajesh Poddar, holding 4.48%. Additionally, individual investors collectively hold a significant portion of 58.67%. There are no institutional holdings from mutual funds or foreign institutional investors, and there are no pledged promoter holdings.

View full answer

Is Vineet Laborator overvalued or undervalued?

09-Jun-2025

As of November 14, 2024, Vineet Laborator is considered overvalued with a PE ratio of -1.44 and an EV to EBITDA of -4.18, indicating significant financial distress compared to peers like Cipla and Dr. Reddy's, and has underperformed the Sensex with a year-to-date return of -50.28%.

As of 14 November 2024, Vineet Laborator has moved from a very attractive to a risky valuation grade. The company is currently considered overvalued, with a price-to-earnings (PE) ratio of -1.44, an EV to EBITDA ratio of -4.18, and a return on equity (ROE) of -80.61%. These figures indicate significant financial distress and a lack of profitability, which are concerning for potential investors.<BR><BR>In comparison to its peers, Vineet Laborator's valuation metrics starkly contrast with companies like Cipla Ltd., which has a PE ratio of 22.99 and an EV to EBITDA of 15.93, and Dr. Reddy's Laboratories Ltd., with a PE of 19.49 and an EV to EBITDA of 12.87. The substantial differences in these ratios highlight the challenges Vineet Laborator faces in the current market. Additionally, the company's stock has underperformed significantly compared to the Sensex, with a year-to-date return of -50.28% against the Sensex's 5.58%, further reinforcing the notion that Vineet Laborator is overvalued at its current price of 31.00.

View full answer

What is the technical trend for Vineet Laborator?

09-Jun-2025

As of May 30, 2025, Vineet Laborator's technical trend is mildly bearish, with mixed signals from indicators like the weekly MACD being mildly bullish and daily moving averages remaining bearish.

As of 30 May 2025, the technical trend for Vineet Laborator has changed from bearish to mildly bearish. The weekly MACD indicates a mildly bullish stance, while the monthly MACD shows a mildly bearish trend. The Bollinger Bands are also signaling mildly bearish on both weekly and monthly time frames. Daily moving averages remain bearish, suggesting short-term weakness. The KST is mildly bullish on the weekly chart but bearish on the monthly, indicating mixed signals. Overall, the current technical stance is mildly bearish, with key indicators such as the daily moving averages and Bollinger Bands contributing to this outlook.

View full answer

Has Vineet Laborator declared dividend?

06-Jun-2025

Yes, Vineet Laboratories Ltd has declared a 10% dividend, amounting to 1 per share, with an ex-date of September 19, 2022. However, the company has experienced significant price declines over various periods, resulting in minimal total returns.

Vineet Laboratories Ltd has declared a 10% dividend.<BR><BR>Dividend Details:<BR>- Percentage announced: 10%<BR>- Amount per share: 1 per share<BR>- Ex-date: 19 Sep 22<BR><BR>Dividend Yield: 0%<BR><BR>Total Returns by Period:<BR>In the 6-month period, the price return was -41.27%, the dividend return was 0%, resulting in a total return of -41.27%.<BR><BR>For the 1-year period, the price return was -45.93%, the dividend return was 0%, leading to a total return of -45.93%.<BR><BR>Over the 2-year period, the price return was -37.8%, the dividend return was 0%, which resulted in a total return of -37.8%.<BR><BR>In the 3-year period, the price return was -49.94%, the dividend return was 1.71%, culminating in a total return of -48.23%.<BR><BR>For the 4-year period, the price return was 0%, the dividend return was 1.78%, resulting in a total return of 1.78%.<BR><BR>In the 5-year period, the price return was 0%, the dividend return was 0%, leading to a total return of 0.0%.<BR><BR>Overall, while Vineet Laboratories Ltd has declared a dividend, the total returns over various periods indicate significant declines in price, with only modest positive returns in the longer-term periods. The absence of substantial dividend returns in most periods suggests a challenging financial performance.

View full answer
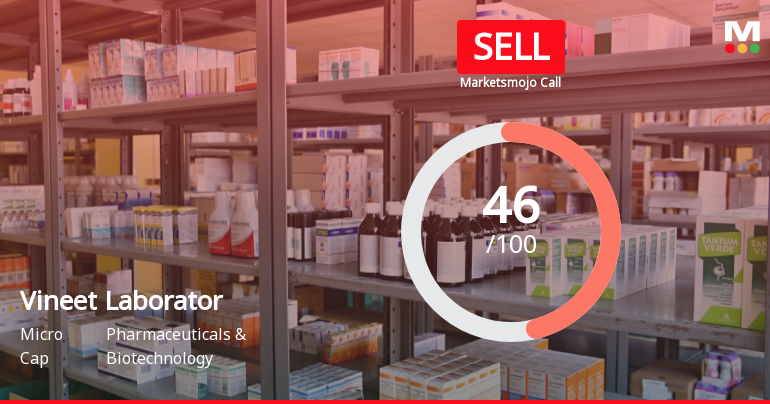
iScoreScore
Click here to find our call on this stock
Strong Sell
Sell
Hold
Buy
Strong Buy

Dashboard

1

Weak Long Term Fundamental Strength with a -14.27% CAGR growth in Operating Profits over the last 5 years

  • Low ability to service debt as the company has a high Debt to EBITDA ratio of -3.67 times
  • The company has been able to generate a Return on Equity (avg) of 5.08% signifying low profitability per unit of shareholders funds
2

Flat results in Dec 25

3

With ROCE of -25.2, it has a Expensive valuation with a 2 Enterprise value to Capital Employed

stock-summaryMojo Parameters

Mojo Parameters

Loading Valuation Snapshot...

Stock DNA

stock-summary
Industry

Pharmaceuticals & Biotechnology

stock-summary
Market cap

INR 72 Cr (Micro Cap)

stock-summary
P/E

65.00

stock-summary
Industry P/E

NA

stock-summary
Dividend Yield

0.00%

stock-summary
Debt Equity

2.96

stock-summary
Return on Equity

7.81%

stock-summary
Price to Book

5.08

Revenue and Profits:
Net Sales:
19 Cr
(Quarterly Results - Mar 2026)
Net Profit:
1 Cr
stock-summaryTotal Returns
Total Returns (Price + Dividend) stock-summary
Dividend Yield (0%)
TimePeriod
Price Return
Dividend Return
Total Return
3 Months
9.82%
0%
9.82%
6 Months
25.22%
0%
25.22%
1 Year
33.45%
0%
33.45%
2 Years
-25.39%
0%
-25.39%
3 Years
-19.13%
0%
-19.13%
4 Years
-22.69%
0%
-22.69%
5 Years
-42.99%
1.26%
-41.73%

Latest dividend: 0.8402289452166803 per share ex-dividend date: Sep-19-2022

Risk Adjusted Returns v/s stock-summary
Returns Beta
Icon
Beta has not been calculated since enough price history is not available
stock-summaryNews & Corporate Actions

Announcements stock-summary

Results-Delay in Financial Results

29-Aug-2026 | Source : BSE

Updated Financial Results for the Quarter and Finacial year ended 31st March 2026

Board Meeting Outcome for Outcome Of Board Meeting Held On Tuesday August 25 2026 As Required Under Regulation 30 Of Securities And Exchange Board Of India (Listing Obligations And Disclosure Requirements) Regulations 2015

25-Aug-2026 | Source : BSE

The Board of Directors of the company in its meeting held today i.e. on August 25 2026 has:

Results-Delay in Financial Results

25-Aug-2026 | Source : BSE

The Board of Director of the company in its meeting held on August 25 2026

Corporate Actions stock-summary

stock-summary
BOARD MEETING

No Upcoming Board Meetings

stock-summary
DIVIDEND

Vineet Laboratories Ltd has declared 10% dividend, ex-date: 19 Sep 22

stock-summary
SPLITS

No Splits history available

stock-summary
BONUS

No Bonus history available

stock-summary
RIGHTS

Vineet Laboratories Ltd has announced 13:12 rights issue, ex-date: 23 Dec 25

stock-summaryKey Factors

Quality key factors stock-summary

Factor
Value
Sales Growth (5y)
-25.34%
EBIT Growth (5y)
-14.27%
EBIT to Interest (avg)
0.85
Debt to EBITDA (avg)
1.59
Net Debt to Equity (avg)
2.96
Sales to Capital Employed (avg)
1.93
Tax Ratio
13.28%
Dividend Payout Ratio
0
Pledged Shares
0
Institutional Holding
0.50%
ROCE (avg)
-4.76%
ROE (avg)
5.08%

Valuation key factors

Factor
Value
P/E Ratio
65
Industry P/E
0
Price to Book Value
5.08
EV to EBIT
18.87
EV to EBITDA
13.47
EV to Capital Employed
2.03
EV to Sales
1.93
PEG Ratio
0.63
Dividend Yield
NA
ROCE (Latest)
-25.22%
ROE (Latest)
7.81%

Technicals key factors

Indicator
Weekly
Monthly
MACD
Bullish
Bullish
RSI
No Signal
No Signal
Bollinger Bands
Mildly Bullish
Mildly Bullish
Moving Averages
Bullish (Daily)
KST
Bullish
Bullish
Dow Theory
Mildly Bullish
No Trend
OBV
Mildly Bearish
Mildly Bearish
stock-summary Technical Indicator Scale: Bearish, Mildly Bearish, Sideways, Mildly Bullish, Bullish  Turned 
stock-summaryShareholding
Shareholding Snapshot : Jun 2026stock-summary
Shareholding Compare (%holding) stock-summary
Majority shareholders

Non Institution

Pledged Promoter Holdings

None

Mutual Funds

Held by 0 Schemes

FIIs

Held by 1 FIIs (0.5%)

Promoter with highest holding

Gaddam Venkata Ramana (2.46%)

Highest Public shareholder

Arjun Aggarwal (11.35%)

Individual Investors Holdings

88.17%

stock-summaryFinancial
[
  {
    "link": "quarterly",
    "btn_text": "All Quarterly Results",
    "header": "Quarterly Results Snapshot (Standalone) - Mar'26 - QoQ",
    "rhs": [
      {
        "prefix": "Net Sales ",
        "suffix": "QoQ Growth in quarter ended Mar 2026 is 20.70% vs -10.16% in Dec 2025",
        "dir": 1
      },
      {
        "prefix": "Standalone Net Profit ",
        "suffix": "QoQ Growth in quarter ended Mar 2026 is -14.12% vs 112.50% in Dec 2025",
        "dir": -1
      }
    ],
    "table": {
      "header": [
        "Mar'26",
        "Dec'25",
        "Change(%)"
      ],
      "body": [
        {
          "field": "Net Sales",
          "val1": "18.89",
          "val2": "15.65",
          "chgp": "20.70%",
          "chgp_class": "positive"
        },
        {
          "field": "Operating Profit (PBDIT) excl Other Income",
          "val1": "2.49",
          "val2": "2.50",
          "chgp": "-0.40%",
          "chgp_class": "negative"
        },
        {
          "field": "Interest",
          "val1": "0.99",
          "val2": "1.09",
          "chgp": "-9.17%",
          "chgp_class": "positive"
        },
        {
          "field": "Exceptional Items",
          "val1": "0.00",
          "val2": "0.00",
          "chgp": "",
          "chgp_class": "neutral"
        },
        {
          "field": "Standalone Net Profit",
          "val1": "0.73",
          "val2": "0.85",
          "chgp": "-14.12%",
          "chgp_class": "negative"
        },
        {
          "field": "Operating Profit Margin (Excl OI)",
          "val1": "13.18%",
          "val2": "15.97%",
          "chgp": "-2.79%",
          "chgp_class": "negative"
        }
      ]
    }
  },
  {
    "link": "half-yearly",
    "btn_text": "All Half Yearly Results",
    "header": "Half Yearly Results Snapshot (Standalone) - Sep'25",
    "rhs": [
      {
        "prefix": "Net Sales ",
        "suffix": " Growth in half year ended Sep 2025 is -41.94% vs -47.07% in Sep 2024",
        "dir": 1
      },
      {
        "prefix": "Standalone Net Profit ",
        "suffix": " Growth in half year ended Sep 2025 is 88.13% vs -438.46% in Sep 2024",
        "dir": 1
      }
    ],
    "table": {
      "header": [
        "Sep'25",
        "Sep'24",
        "Change(%)"
      ],
      "body": [
        {
          "field": "Net Sales",
          "val1": "24.86",
          "val2": "42.82",
          "chgp": "-41.94%",
          "chgp_class": "negative"
        },
        {
          "field": "Operating Profit (PBDIT) excl Other Income",
          "val1": "3.49",
          "val2": "-1.10",
          "chgp": "417.27%",
          "chgp_class": "positive"
        },
        {
          "field": "Interest",
          "val1": "2.80",
          "val2": "2.13",
          "chgp": "31.46%",
          "chgp_class": "negative"
        },
        {
          "field": "Exceptional Items",
          "val1": "0.00",
          "val2": "0.00",
          "chgp": "",
          "chgp_class": "neutral"
        },
        {
          "field": "Standalone Net Profit",
          "val1": "-0.47",
          "val2": "-3.96",
          "chgp": "88.13%",
          "chgp_class": "positive"
        },
        {
          "field": "Operating Profit Margin (Excl OI)",
          "val1": "14.04%",
          "val2": "-2.57%",
          "chgp": "16.61%",
          "chgp_class": "positive"
        }
      ]
    }
  },
  {
    "link": "nine-monthly",
    "btn_text": "All Nine Monthly Results",
    "header": "Nine Monthly Results Snapshot (Standalone) - Dec'25",
    "rhs": [
      {
        "prefix": "Net Sales ",
        "suffix": "YoY Growth in nine months ended Dec 2025 is -33.50% vs -46.35% in Dec 2024",
        "dir": 1
      },
      {
        "prefix": "Standalone Net Profit ",
        "suffix": "YoY Growth in nine months ended Dec 2025 is 103.93% vs -974.44% in Dec 2024",
        "dir": 1
      }
    ],
    "table": {
      "header": [
        "Dec'25",
        "Dec'24",
        "Change(%)"
      ],
      "body": [
        {
          "field": "Net Sales",
          "val1": "40.51",
          "val2": "60.92",
          "chgp": "-33.50%",
          "chgp_class": "negative"
        },
        {
          "field": "Operating Profit (PBDIT) excl Other Income",
          "val1": "5.99",
          "val2": "-5.23",
          "chgp": "214.53%",
          "chgp_class": "positive"
        },
        {
          "field": "Interest",
          "val1": "3.89",
          "val2": "3.08",
          "chgp": "26.30%",
          "chgp_class": "negative"
        },
        {
          "field": "Exceptional Items",
          "val1": "0.00",
          "val2": "0.00",
          "chgp": "",
          "chgp_class": "neutral"
        },
        {
          "field": "Standalone Net Profit",
          "val1": "0.38",
          "val2": "-9.67",
          "chgp": "103.93%",
          "chgp_class": "positive"
        },
        {
          "field": "Operating Profit Margin (Excl OI)",
          "val1": "14.79%",
          "val2": "-8.59%",
          "chgp": "23.38%",
          "chgp_class": "positive"
        }
      ]
    }
  },
  {
    "link": "annual",
    "btn_text": "All Annual Results",
    "header": "Annual Results Snapshot (Standalone) - Mar'26",
    "rhs": [
      {
        "prefix": "Net Sales ",
        "suffix": "YoY Growth in year ended Mar 2026 is -20.80% vs -50.20% in Mar 2025",
        "dir": 1
      },
      {
        "prefix": "Standalone Net Profit ",
        "suffix": "YoY Growth in year ended Mar 2026 is 105.50% vs -2,060.19% in Mar 2025",
        "dir": 1
      }
    ],
    "table": {
      "header": [
        "Mar'26",
        "Mar'25",
        "Change(%)"
      ],
      "body": [
        {
          "field": "Net Sales",
          "val1": "59.40",
          "val2": "75.00",
          "chgp": "-20.80%",
          "chgp_class": "negative"
        },
        {
          "field": "Operating Profit (PBDIT) excl Other Income",
          "val1": "8.47",
          "val2": "-16.28",
          "chgp": "152.03%",
          "chgp_class": "positive"
        },
        {
          "field": "Interest",
          "val1": "4.89",
          "val2": "3.98",
          "chgp": "22.86%",
          "chgp_class": "negative"
        },
        {
          "field": "Exceptional Items",
          "val1": "0.00",
          "val2": "0.00",
          "chgp": "",
          "chgp_class": "neutral"
        },
        {
          "field": "Standalone Net Profit",
          "val1": "1.11",
          "val2": "-20.19",
          "chgp": "105.50%",
          "chgp_class": "positive"
        },
        {
          "field": "Operating Profit Margin (Excl OI)",
          "val1": "14.26%",
          "val2": "-21.71%",
          "chgp": "35.97%",
          "chgp_class": "positive"
        }
      ]
    }
  }
]

Quarterly Results Snapshot (Standalone) - Mar'26 - QoQstock-summary

Mar'26
Dec'25
Change(%)
Net Sales
18.89
15.65
20.70%
Operating Profit (PBDIT) excl Other Income
2.49
2.50
-0.40%
Interest
0.99
1.09
-9.17%
Exceptional Items
0.00
0.00
Standalone Net Profit
0.73
0.85
-14.12%
Operating Profit Margin (Excl OI)
13.18%
15.97%
-2.79%
Values in Rs Cr.
Direction Arrows
Net Sales

QoQ Growth in quarter ended Mar 2026 is 20.70% vs -10.16% in Dec 2025

Direction Arrows
Standalone Net Profit

QoQ Growth in quarter ended Mar 2026 is -14.12% vs 112.50% in Dec 2025

Half Yearly Results Snapshot (Standalone) - Sep'25stock-summary

Sep'25
Sep'24
Change(%)
Net Sales
24.86
42.82
-41.94%
Operating Profit (PBDIT) excl Other Income
3.49
-1.10
417.27%
Interest
2.80
2.13
31.46%
Exceptional Items
0.00
0.00
Standalone Net Profit
-0.47
-3.96
88.13%
Operating Profit Margin (Excl OI)
14.04%
-2.57%
16.61%
Values in Rs Cr.
Direction Arrows
Net Sales

Growth in half year ended Sep 2025 is -41.94% vs -47.07% in Sep 2024

Direction Arrows
Standalone Net Profit

Growth in half year ended Sep 2025 is 88.13% vs -438.46% in Sep 2024

Nine Monthly Results Snapshot (Standalone) - Dec'25stock-summary

Dec'25
Dec'24
Change(%)
Net Sales
40.51
60.92
-33.50%
Operating Profit (PBDIT) excl Other Income
5.99
-5.23
214.53%
Interest
3.89
3.08
26.30%
Exceptional Items
0.00
0.00
Standalone Net Profit
0.38
-9.67
103.93%
Operating Profit Margin (Excl OI)
14.79%
-8.59%
23.38%
Values in Rs Cr.
Direction Arrows
Net Sales

YoY Growth in nine months ended Dec 2025 is -33.50% vs -46.35% in Dec 2024

Direction Arrows
Standalone Net Profit

YoY Growth in nine months ended Dec 2025 is 103.93% vs -974.44% in Dec 2024

Annual Results Snapshot (Standalone) - Mar'26stock-summary

Mar'26
Mar'25
Change(%)
Net Sales
59.40
75.00
-20.80%
Operating Profit (PBDIT) excl Other Income
8.47
-16.28
152.03%
Interest
4.89
3.98
22.86%
Exceptional Items
0.00
0.00
Standalone Net Profit
1.11
-20.19
105.50%
Operating Profit Margin (Excl OI)
14.26%
-21.71%
35.97%
Values in Rs Cr.
Direction Arrows
Net Sales

YoY Growth in year ended Mar 2026 is -20.80% vs -50.20% in Mar 2025

Direction Arrows
Standalone Net Profit

YoY Growth in year ended Mar 2026 is 105.50% vs -2,060.19% in Mar 2025

stock-summaryCompany CV
About Vineet Laboratories Ltd stock-summary
stock-summary
Vineet Laboratories Ltd
Micro Cap
Pharmaceuticals & Biotechnology
Vineet Laboratories Limited (Formerly known as Ortin Laboratories Limited) is a manufacturing company of intermediates useful for the manufacture of active pharmaceutical ingredients. The Company was incorporated on 10 November 2016 and operates in the business of in the manufacture of Drug Intermediates & Bulk Dugs.
Company Coordinates stock-summary
Company Details
SyNo 11/A3 Saheb Nagar KurduVi, Chintal Kunta Eshwaramma LB Nr Hyderabad Telangana : 500074
stock-summary
Tel: 91-40-24128833
stock-summary
cs@vineetlabs.co.in
Registrar Details