
Compare Vintage Coffee with Similar Stocks
Dashboard
Poor Management Efficiency with a low ROCE of 9.96%
- The company has been able to generate a Return on Capital Employed (avg) of 9.96% signifying low profitability per unit of total capital (equity and debt)
Healthy long term growth as Net Sales has grown by an annual rate of 106.41% and Operating profit at 104.93%
The company has declared Positive results for the last 15 consecutive quarters
With ROE of 12.7, it has a Attractive valuation with a 3.9 Price to Book Value
25.95% of Promoter Shares are Pledged
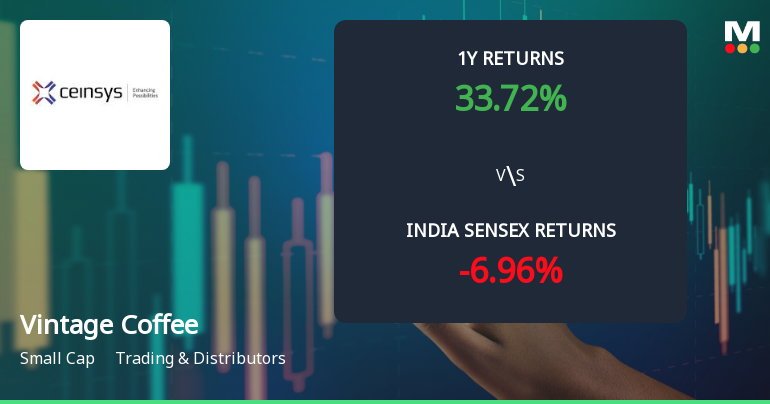
Consistent Returns over the last 3 years
Stock DNA
Trading & Distributors
INR 2,248 Cr (Small Cap)
30.00
59
0.06%
0.07
12.68%
3.98
Total Returns (Price + Dividend) 
Latest dividend: 0.1 per share ex-dividend date: Sep-22-2025
Risk Adjusted Returns v/s
Returns Beta

News
Vintage Coffee & Beverages Ltd Technical Momentum Shifts Amid Mixed Indicators
Vintage Coffee & Beverages Ltd has experienced a notable shift in its technical momentum, transitioning from a mildly bullish trend to a sideways pattern. This change is underscored by a complex interplay of technical indicators, including MACD, RSI, moving averages, and Bollinger Bands, reflecting a nuanced outlook for investors in the trading and distributors sector.
Read full news article
Vintage Coffee & Beverages Ltd Sees Technical Momentum Shift Amid Strong Returns
Vintage Coffee & Beverages Ltd, a small-cap player in the Trading & Distributors sector, has recently exhibited a notable shift in its technical momentum, moving from a sideways trend to a mildly bullish stance. This change is underscored by mixed signals from key technical indicators such as MACD, RSI, Bollinger Bands, and moving averages, reflecting a nuanced market sentiment as the stock trades near ₹160, up 5.19% on the day.
Read full news article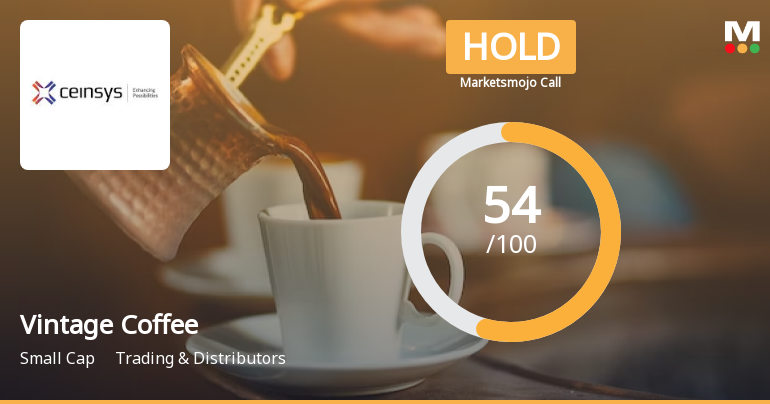
Vintage Coffee & Beverages Ltd is Rated Hold
Vintage Coffee & Beverages Ltd is rated 'Hold' by MarketsMOJO, with this rating last updated on 05 Jun 2026. However, the analysis and financial metrics discussed here reflect the stock's current position as of 19 June 2026, providing investors with the latest insights into its performance and outlook.
Read full news article Announcements
Closure of Trading Window
22-Jun-2026 | Source : BSEClosure of trading window
Intimation Of Analyst / Institutional Investor Meeting Under Regulation 30 Of The SEBI (Listing Obligations And Disclosure Requirements) Regulations 2015
18-Jun-2026 | Source : BSESchedule of investors meet
Intimation Under Regulation 30 Of The SEBI (Listing Obligations And Disclosure Requirements) Regulations 2015 - Stoppage Of Production Activities On Account Of Annual Maintenance At Its 100% Subsidiary Namely Vintage Coffee Private Limited Factory
18-Jun-2026 | Source : BSEIntimation under Reg. 30 of SEBI (LODR) Regulations 2015
Corporate Actions

No Upcoming Board Meetings

Vintage Coffee & Beverages Ltd has declared 1% dividend, ex-date: 22 Sep 25

No Splits history available

No Bonus history available

Vintage Coffee & Beverages Ltd has announced 1:2 rights issue, ex-date: 19 Jun 23
Quality key factors
Valuation key factors
Technicals key factors
 Technical Indicator Scale: Bearish, Mildly Bearish, Sideways, Mildly Bullish, Bullish Turned
 Shareholding Snapshot : Mar 2026
Shareholding Compare (%holding)
Non Institution
25.9479
Held by 2 Schemes (6.62%)
Held by 28 FIIs (4.83%)
Balakrishna Tati (13.57%)
Bandhan Small Cap Fund (5.44%)
32.27%
Quarterly Results Snapshot (Consolidated) - Mar'26 - YoY

YoY Growth in quarter ended Mar 2026 is 57.23% vs 148.03% in Mar 2025
YoY Growth in quarter ended Mar 2026 is 34.34% vs 263.72% in Mar 2025
Half Yearly Results Snapshot (Consolidated) - Sep'25
Growth in half year ended Sep 2025 is 105.87% vs 125.90% in Sep 2024
Growth in half year ended Sep 2025 is 166.14% vs 194.62% in Sep 2024
Nine Monthly Results Snapshot (Consolidated) - Dec'25
YoY Growth in nine months ended Dec 2025 is 90.65% vs 129.44% in Dec 2024
YoY Growth in nine months ended Dec 2025 is 108.81% vs 219.14% in Dec 2024
Annual Results Snapshot (Consolidated) - Mar'26
YoY Growth in year ended Mar 2026 is 79.26% vs 135.44% in Mar 2025
YoY Growth in year ended Mar 2026 is 79.80% vs 235.14% in Mar 2025
About Vintage Coffee & Beverages Ltd

Company Coordinates


