
Compare Vippy Spinpro with Similar Stocks
Dashboard
High Management Efficiency with a high ROCE of 17.65%
Strong ability to service debt as the company has a low Debt to EBITDA ratio of 1.54 times
Flat results in Mar 26
With ROCE of 13.2, it has a Attractive valuation with a 1.1 Enterprise value to Capital Employed
Majority shareholders : Promoters
Stock DNA
Garments & Apparels
INR 105 Cr (Micro Cap)
8.00
25
0.00%
0.37
13.20%
1.11
Total Returns (Price + Dividend) 
Latest dividend: 0.5 per share ex-dividend date: Sep-19-2007
Risk Adjusted Returns v/s
Returns Beta

News

Vippy Spinpro Ltd Upgraded to Hold by MarketsMOJO on Technical and Valuation Improvements
Vippy Spinpro Ltd, a micro-cap player in the Garments & Apparels sector, has seen its investment rating upgraded from Sell to Hold as of 9 June 2026. This change reflects a combination of improved technical indicators, attractive valuation metrics, stable financial trends, and solid quality parameters, signalling a cautious but optimistic outlook for investors.
Read full news article
Vippy Spinpro Ltd is Rated Sell
Vippy Spinpro Ltd is rated 'Sell' by MarketsMOJO, with this rating last updated on 22 May 2026. While the rating change occurred on that date, the analysis and financial metrics discussed here reflect the stock's current position as of 03 June 2026, providing investors with the most up-to-date perspective on the company’s performance and outlook.
Read full news article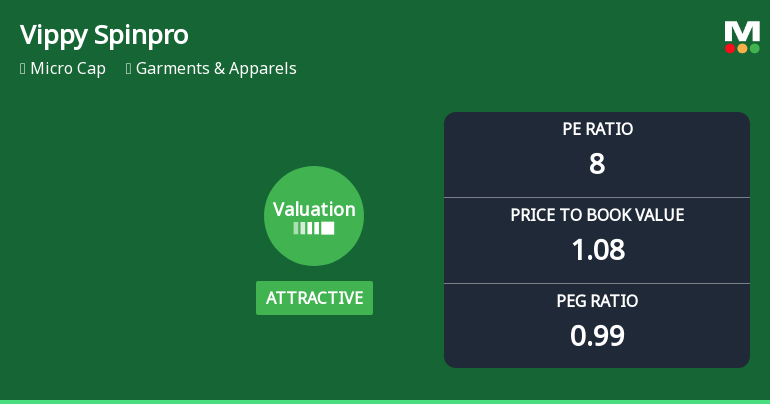
Vippy Spinpro Ltd Valuation Improves Amidst Mixed Market Returns
Vippy Spinpro Ltd, a micro-cap player in the Garments & Apparels sector, has seen its valuation parameters shift favourably, moving from very attractive to attractive territory. With a current price of ₹172.90 and a market cap reflecting its micro-cap status, the company’s price-to-earnings (P/E) ratio now stands at 8.16, signalling improved price attractiveness relative to its historical and peer averages.
Read full news article Announcements
Announcement under Regulation 30 (LODR)-Newspaper Publication
23-May-2026 | Source : BSECopy of Newspaper Publication of Extract of Audited Financials Results of the Company for the Quarter and Financial Year ended on 31st March 2026.
Appointment Of Internal Auditor And Cost Auditor.
22-May-2026 | Source : BSEAppointment of Internal Auditor and Cost Auditor.
Board Meeting Outcome for Outcome Of Board Meeting Dated 22.05.2026.
22-May-2026 | Source : BSEThis is to inform you that the Board of Directors of the Company at its Meeting held today i.e. 22nd May 2026 inter-alia considered and: 1. Approved the Audited Financial Statements of the Company for the financial year ended 31st March 2026. 2. Approved the Audited Financial Results of the Company for the quarter and financial year ended 31st March 2026. 3. Auditors Report in this purpose. Please find enclosed herewith: (i) Auditors Report on the Financial Results for the year ended 31st March 2026. (ii) The Audited Financial Results of the Company for the quarter and financial year ended 31st March 2026. (iii) Declaration in respect of Unmodified opinion under Regulation 33(3)(d) of the Securities and Exchange Board of India (Listing Obligations and Disclosure Requirements) Regulations 2015. The Board Meeting commenced at 05:00 P.M. (17:00 P.M.) and concluded at 07:05 P.M. (19:05 P.M.) Kindly take the above information on your records.
Corporate Actions

No Upcoming Board Meetings

Vippy Spinpro Ltd has declared 5% dividend, ex-date: 19 Sep 07

No Splits history available

No Bonus history available

No Rights history available
Quality key factors
Valuation key factors
Technicals key factors
 Technical Indicator Scale: Bearish, Mildly Bearish, Sideways, Mildly Bullish, Bullish Turned
 Shareholding Snapshot : Mar 2026
Shareholding Compare (%holding)
Promoters
None
Held by 2 Schemes (0.03%)
Held by 0 FIIs
Usha Mutha (11.61%)
Jr Seamless Private Limited (3.13%)
26.22%
Quarterly Results Snapshot (Standalone) - Mar'26 - QoQ

QoQ Growth in quarter ended Mar 2026 is 59.80% vs 5.05% in Dec 2025
QoQ Growth in quarter ended Mar 2026 is 84.70% vs -33.45% in Dec 2025
Half Yearly Results Snapshot (Standalone) - Sep'25

Growth in half year ended Sep 2025 is -11.12% vs 10.48% in Sep 2024
Growth in half year ended Sep 2025 is 29.94% vs 543.21% in Sep 2024
Nine Monthly Results Snapshot (Standalone) - Dec'25
YoY Growth in nine months ended Dec 2025 is -14.29% vs 12.40% in Dec 2024
YoY Growth in nine months ended Dec 2025 is -3.80% vs 465.82% in Dec 2024
Annual Results Snapshot (Standalone) - Mar'26
YoY Growth in year ended Mar 2026 is -4.03% vs 11.95% in Mar 2025
YoY Growth in year ended Mar 2026 is 4.26% vs 164.14% in Mar 2025
About Vippy Spinpro Ltd

Company Coordinates


