
Compare Vishal Mega Mart with Similar Stocks
Dashboard
Flat results in Mar 26
- PBT LESS OI(Q) At Rs 200.78 cr has Fallen at -17.6% (vs previous 4Q average)
- PAT(Q) At Rs 167.92 cr has Fallen at -14.6% (vs previous 4Q average)
With ROE of 11.3, it has a Very Expensive valuation with a 7.5 Price to Book Value
Reducing Promoter Confidence
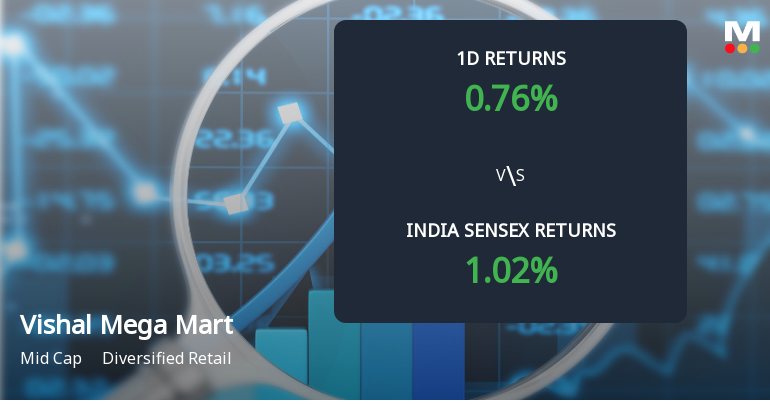
Underperformed the market in the last 1 year
Stock DNA
Diversified Retail
INR 55,228 Cr (Mid Cap)
66.00
77
0.00%
0.04
11.32%
7.45
Total Returns (Price + Dividend) 
Vishal Mega Mart for the last several years.
Risk Adjusted Returns v/s
Returns Beta

News
Vishal Mega Mart Sees Significant Open Interest Surge Amid Mixed Market Signals
Vishal Mega Mart Ltd (VMM), a mid-cap player in the diversified retail sector, has witnessed a notable surge in open interest (OI) in its derivatives segment, signalling heightened market activity and shifting investor positioning. Despite a modest 1.23% price gain on 24 Jun 2026, the stock’s underlying metrics reveal a complex interplay of bullish and cautious sentiments among traders.
Read full news article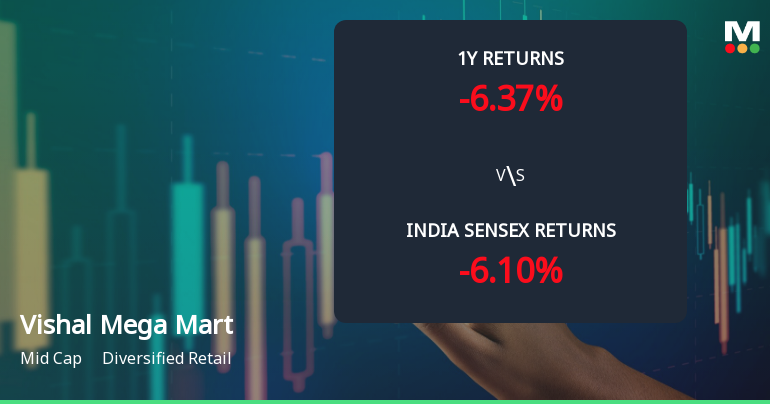
Vishal Mega Mart Ltd Faces Technical Setback Amid Bearish Momentum Shift
Vishal Mega Mart Ltd, a mid-cap player in the diversified retail sector, has experienced a notable shift in its technical momentum, transitioning from a sideways trend to a mildly bearish stance. Recent technical indicators reveal a complex interplay of signals, with mixed readings from MACD, RSI, moving averages, and other momentum oscillators, reflecting cautious investor sentiment amid a challenging market backdrop.
Read full news article
Vishal Mega Mart Ltd is Rated Sell
Vishal Mega Mart Ltd is rated Sell by MarketsMOJO, with this rating last updated on 12 May 2026. However, the analysis and financial metrics discussed here reflect the stock’s current position as of 15 June 2026, providing investors with the latest insights into the company’s performance and outlook.
Read full news article Announcements
Intimation Of Grant Of 975000 Stock Options Under Vishal Mega Mart Employees Stock Options Plan 2019
15-Jun-2026 | Source : BSEIntimation of grant of 975000 Stock Options under Vishal Mega Mart Employees Stock Options Plan 2019
Announcement under Regulation 30 (LODR)-Change in Management
15-Jun-2026 | Source : BSEAppointment of Mr. Sashi Gumma as Chief of Operations and Senior Management Personnel of the Company
Disclosure Under Regulation 30 Of SEBI (Listing Obligations And Disclosure Requirements) Regulations 2015
12-Jun-2026 | Source : BSEDisclosure under Regulation 30 of SEBI (Listing Obligations and Disclosure Requirements) Regulations 2015
Corporate Actions

No Upcoming Board Meetings

No Dividend history available

No Splits history available

No Bonus history available

No Rights history available
Quality key factors
Valuation key factors
Technicals key factors
 Technical Indicator Scale: Bearish, Mildly Bearish, Sideways, Mildly Bullish, Bullish Turned
 Shareholding Snapshot : Mar 2026
Shareholding Compare (%holding)
Promoters
None
Held by 33 Schemes (28.89%)
Held by 483 FIIs (22.01%)
Samayat Services Llp (40.12%)
Government Of Singapore (2.81%)
4.14%
Quarterly Results Snapshot (Consolidated) - Mar'26 - QoQ

QoQ Growth in quarter ended Mar 2026 is -15.16% vs 23.11% in Dec 2025
QoQ Growth in quarter ended Mar 2026 is -46.34% vs 105.45% in Dec 2025
Half Yearly Results Snapshot (Standalone) - Sep'25
Not Applicable: The company has declared_date for only one period
Not Applicable: The company has declared_date for only one period
Nine Monthly Results Snapshot (Standalone) - Dec'25
Not Applicable: The company has declared_date for only one period
Not Applicable: The company has declared_date for only one period
Annual Results Snapshot (Consolidated) - Mar'26

YoY Growth in year ended Mar 2026 is 20.44% vs 20.25% in Mar 2025
YoY Growth in year ended Mar 2026 is 32.80% vs 36.81% in Mar 2025
About Vishal Mega Mart Ltd

Company Coordinates


