Vivanta Indust.

  • Market Cap: Micro Cap
  • Industry: Construction
  • ISIN: INE299W01022
  • NSEID:
  • BSEID: 541735
INR
1.88
-0.03 (-1.57%)
BSENSE

May 06

BSE+NSE Vol: 130599

  • Price Points
  • Score
  • Mojo Parameters
  • Total Return
  • News and Corporate Actions
  • Key factors
  • Shareholding
  • Financials
  • CompanyCV
stock-recommendationUpcoming Result: Vivanta Indust. will declare its result soon on 08 May 2026
stock-summaryPrice Point
High/Low

1Day

52 Week

Valuation
Technical
Day's Volume

CASH

1.31 lacs (-5.64%) Volume

Shareholding (Mar 2026)

FII

0.00%

Held by 0 FIIs

DII

0.00%

Held by 0 DIIs

Promoter

10.60%

What does Vivanta Indust. do?

06-Jun-2025

Vivanta Industries Ltd is a micro-cap company in the construction sector, originally trading in steel and electronics. As of March 2025, it reported net sales of ₹102 Cr and a net loss of ₹2 Cr, with a market cap of ₹39 Cr.

Overview:<BR>Vivanta Industries Ltd is a micro-cap company operating in the construction industry, initially involved in trading steel products, electronic items, and dealing in shares and securities.<BR><BR>History:<BR>Vivanta Industries Ltd was incorporated in 2013 as Vernes Infotech Private Limited and later converted to a Public Limited Company in 2017, changing its name to Vivanta Industries Limited. The latest quarterly results reported net sales and net profit for March 2025.<BR><BR>Financial Snapshot:<BR>- Net Sales: 102 Cr (Quarterly Results - Mar 2025)<BR>- Net Profit: -2 Cr (Quarterly Results - Mar 2025)<BR>- Market Cap: Rs 39 Cr (Micro Cap)<BR><BR>Key Metrics:<BR>- P/E: N/A (Loss Making)<BR>- Industry P/E: 41<BR>- Dividend Yield: 0.00%<BR>- Debt-Equity: 1.29<BR>- Return on Equity: -7.84%<BR>- Price to Book: 2.30<BR><BR>Contact Details:<BR>Address: 403/TF Sarthik II Opp Rajpath, Club SG Highway Bodakdev Ahmedabad Gujarat : 380054<BR>Tel: 91-079-26870952<BR>Email: business@vivantaindustries.com<BR>Website: http://www.vivantaindustries.com

View full answer

Who are in the management team of Vivanta Indust.?

06-Jun-2025

As of March 2022, the management team of Vivanta Industries includes Hemant Amrish Parikh (Managing Director), Jainil R Bhatt (Director), Tushar Gandhi, Rushabh Shah, and Apeksha Vyas (Independent Directors), and Aesha Safi (Company Secretary & Compliance Officer). Each member contributes to the company's governance and operations.

As of March 2022, the management team of Vivanta Indust. includes the following members:<BR><BR>1. Hemant Amrish Parikh - Managing Director<BR>2. Jainil R Bhatt - Director<BR>3. Tushar Gandhi - Independent Director<BR>4. Aesha Safi - Company Secretary & Compliance Officer<BR>5. Rushabh Shah - Independent Director<BR>6. Apeksha Vyas - Independent Director<BR><BR>Each member plays a key role in the company's governance and operations.

View full answer

What is the bonus history of the Vivanta Indust.?

06-Jun-2025

Vivanta Industries Ltd announced a 1:4 bonus issue on September 5, 2023, granting shareholders one additional share for every four shares held. The record date for this bonus was also September 5, 2023.

Vivanta Industries Ltd has a recent bonus history that includes a 1:4 bonus issue, which was announced with an ex-date of September 5, 2023. This means that for every four shares held, shareholders received one additional share as a bonus. The record date for this bonus was also September 5, 2023. If you have any more questions about Vivanta Industries or need further details, feel free to ask!

View full answer

Has Vivanta Indust. declared dividend?

06-Jun-2025

Vivanta Industries Ltd has declared a 3% dividend, amounting to 0.03 per share, with an ex-date of September 5, 2023. Despite this, the dividend yield is 0%, and total returns have varied significantly, showing strong performance over longer periods despite recent declines.

Vivanta Industries Ltd has declared a 3% dividend.<BR><BR>Dividend Details:<BR>- Percentage announced: 3%<BR>- Amount per share: 0.03<BR>- Ex-date: 05 Sep 2023<BR><BR>Dividend Yield: 0%<BR><BR>Total Returns by Period:<BR>Over the past 6 months, the price return was -18.97%, with a dividend return of 0%, resulting in a total return of -18.97%.<BR><BR>In the last year, the price return was -26.17%, the dividend return was 0%, leading to a total return of -26.17%.<BR><BR>Over a 2-year period, the price return was -45.12%, with a dividend return of 0.54%, resulting in a total return of -44.58%.<BR><BR>In the 3-year period, the price return was 123.8%, the dividend return was 2.46%, culminating in a total return of 126.26%.<BR><BR>For the 4-year period, the price return was 133.45%, with a dividend return of 3.66%, resulting in a total return of 137.11%.<BR><BR>Finally, over the past 5 years, the price return was 1171.26%, the dividend return was 17.65%, leading to a total return of 1188.91%.<BR><BR>Overall, while Vivanta Industries Ltd has declared a dividend, the dividend yield remains at 0%, indicating limited income from dividends relative to the share price. The total returns show significant fluctuations, with strong performance over longer periods despite recent negative trends.

View full answer

Who are the peers of the Vivanta Indust.?

03-Jun-2025

Vivanta Indust.'s peers include Larsen & Toubro, Rail Vikas, Altius Telecom, NBCC, IRB Infra.Devl., Julien Agro, Popular Estate, PVV Infra Ltd, and Premier Energy. In terms of management risk, Vivanta Indust. is rated below average, with a 1-year return of -25.19%, better than Julien Agro but worse than NBCC, which has the highest return at 24.25%.

Peers: The peers of Vivanta Indust. are Larsen & Toubro, Rail Vikas, Altius Telecom, NBCC, IRB Infra.Devl., Julien Agro, Popular Estate, PVV Infra Ltd, Premier Energy.<BR><BR>Quality Snapshot: Excellent management risk is observed at NBCC and Julien Agro, while Good management risk is found at Larsen & Toubro. Average management risk is noted for Rail Vikas and IRB Infra.Devl., while Below Average management risk is present at Altius Telecom, Vivanta Indust., and PVV Infra Ltd. Growth is Excellent at Altius Telecom, Good at NBCC and PVV Infra Ltd, Average at Larsen & Toubro and Julien Agro, and Below Average at Rail Vikas, IRB Infra.Devl., Vivanta Indust., and the rest. Capital Structure is Excellent at NBCC, Good at Julien Agro and PVV Infra Ltd, Below Average at Larsen & Toubro, Altius Telecom, IRB Infra.Devl., Vivanta Indust., and the rest, while Popular Estate and Premier Energy do not qualify.<BR><BR>Return Snapshot: The peer with the highest 1-year return is NBCC at 24.25%, while the lowest is Julien Agro at -45.20%. Vivanta Indust. has a 1-year return of -25.19%, which is better than Julien Agro but worse than NBCC. Additionally, the six-month return is negative for IRB Infra.Devl., Julien Agro, PVV Infra Ltd, and Yuranus Infrast.

View full answer

Is Vivanta Indust. overvalued or undervalued?

09-Jun-2025

As of February 5, 2025, Vivanta Industries is considered overvalued and risky, with a negative PE ratio of -29.08 and poor stock performance, contrasting sharply with stronger peers like Supreme Industries and Astral Ltd.

As of 5 February 2025, the valuation grade for Vivanta Industries has moved from expensive to risky, indicating a significant shift in its perceived value. The company is currently considered overvalued. Key ratios reveal a PE ratio of -29.08, an EV to EBITDA of -43.19, and a Price to Book Value of 2.28, all of which suggest underlying financial challenges.<BR><BR>In comparison to its peers, Vivanta Industries stands out with a notably negative PE ratio, while Supreme Industries Ltd. and Astral Ltd. have PE ratios of 57.34 and 78.35, respectively, reflecting their strong market positions. Additionally, the company's recent stock performance has been underwhelming, with a year-to-date return of -18.11%, contrasting sharply with the Sensex's positive return of 5.60% during the same period. Overall, these factors reinforce the conclusion that Vivanta Industries is overvalued in the current market landscape.

View full answer

What is the technical trend for Vivanta Indust.?

09-Jun-2025

As of May 19, 2025, Vivanta Industries shows a mildly bearish trend overall, with mixed signals from key indicators indicating short-term positive momentum but longer-term weakness.

As of 19 May 2025, the technical trend for Vivanta Indust. has changed from bearish to mildly bearish. The weekly MACD and KST are both mildly bullish, suggesting some positive momentum, while the monthly MACD and KST remain bearish, indicating longer-term weakness. The weekly Bollinger Bands also reflect a mildly bullish stance, but the daily moving averages are mildly bearish, which adds to the mixed signals. The Dow Theory shows a mildly bullish trend on the weekly chart, but no trend on the monthly chart. Overall, the current technical stance is mildly bearish, with key indicators showing a divergence between short-term and long-term trends.

View full answer

Who are the top shareholders of the Vivanta Indust.?

17-Jul-2025

The top shareholders of Vivanta Indust. are Parth Hemant Parikh, the largest promoter with 7.02%, and Jayntibhai Hirdas Patel, the highest public shareholder at 1.69%. Individual investors hold a significant 85.62% of the shares, with no mutual funds or foreign institutional investors involved.

The top shareholders of Vivanta Indust. include Parth Hemant Parikh, who is the promoter with the highest holding at 7.02%. The highest public shareholder is Jayntibhai Hirdas Patel, holding 1.69%. Additionally, individual investors collectively hold a significant portion of the company, accounting for 85.62% of the shares. There are no mutual funds or foreign institutional investors currently holding shares in the company, and there are no pledged promoter holdings.

View full answer

How big is Vivanta Indust.?

24-Jul-2025

As of 24th July, Vivanta Industries Ltd has a market capitalization of 37.00 Cr and reported Net Sales of 109.81 Cr with a Net Profit loss of 1.32 Cr for the latest four quarters. Shareholder's Funds are 16.77 Cr and Total Assets are 49.64 Cr as of March 2024.

As of 24th July, Vivanta Industries Ltd has a market capitalization of 37.00 Cr, categorizing it as a Micro Cap company.<BR><BR>For the latest four quarters, the company reported Net Sales of 109.81 Cr. However, it experienced a loss of 1.32 Cr in Net Profit during the same period.<BR><BR>The latest annual reporting period for the balance sheet is March 2024. Shareholder's Funds are recorded at 16.77 Cr, while Total Assets amount to 49.64 Cr.

View full answer

How has been the historical performance of Vivanta Indust.?

13-Nov-2025

Vivanta Indust. has shown significant sales growth from 0.36 Cr in Mar'21 to 109.80 Cr in Mar'25, but faced rising expenditures leading to negative operating profit and profit after tax of -1.32 Cr in Mar'25. Total assets and liabilities increased substantially, while cash flow from operations remained negative at -5.00 Cr in Mar'25.

Answer:<BR>The historical performance of Vivanta Indust. shows significant fluctuations over the years, particularly in net sales and profitability.<BR><BR>Breakdown:<BR>Vivanta Indust. has experienced a dramatic increase in net sales, rising from 0.36 Cr in Mar'21 to 109.80 Cr in Mar'25. This growth is reflected in total operating income, which also surged from 0.36 Cr in Mar'21 to 109.80 Cr in Mar'25. However, the company faced challenges with total expenditure, which escalated from 0.51 Cr in Mar'21 to 111.20 Cr in Mar'25, leading to an operating profit (PBDIT) of -0.82 Cr in Mar'25, down from 1.52 Cr in Mar'24. Profit before tax mirrored this trend, declining from 1.29 Cr in Mar'24 to -1.32 Cr in Mar'25, resulting in a profit after tax of -1.32 Cr in Mar'25 compared to 0.93 Cr in Mar'24. The company's total assets increased significantly from 23.73 Cr in Mar'21 to 123.98 Cr in Mar'25, while total liabilities also rose from 23.73 Cr to 123.98 Cr in the same period. Cash flow from operating activities remained negative, with -5.00 Cr in Mar'25, indicating ongoing operational challenges despite the growth in sales.

View full answer

Are Vivanta Industries Ltd latest results good or bad?

13-Feb-2026

Vivanta Industries Ltd's latest results show a mixed outlook, with a net profit of ₹1.24 crore and extraordinary revenue growth of 2,072.82%, but significant concerns remain due to a low operating margin of 0.01% and a 37.05% decline in stock performance over the past year, indicating ongoing challenges. Investors should proceed with caution.

Vivanta Industries Ltd's latest results present a mixed picture, showing some positive developments alongside significant concerns. <BR><BR>On the positive side, the company reported a net profit of ₹1.24 crore in Q3 FY26, a notable turnaround from previous losses, indicating a potential shift towards profitability. Additionally, revenue growth has been extraordinary, with a year-on-year increase of 2,072.82%, reflecting a jump from ₹3.09 crores in Q3 FY25 to ₹67.14 crores in Q3 FY26. This dramatic growth is impressive, but it is essential to consider the context of this performance.<BR><BR>However, there are critical red flags. The operating margin is alarmingly low at just 0.01%, down from 5.83% a year earlier, suggesting that the company is struggling to convert its revenue into sustainable profits. This near-zero profitability raises questions about the viability of its business model. Moreover, the reliance on other income, which accounted for a significant portion of the profit, indicates that the core operations are not generating sufficient earnings.<BR><BR>The stock performance has also been disappointing, with a decline of 37.05% over the past year, which is significantly worse than the broader construction sector. This underperformance suggests that the challenges faced by Vivanta Industries are company-specific rather than reflective of the overall market conditions.<BR><BR>In summary, while there are some signs of improvement, particularly in terms of net profit and revenue growth, the fundamental issues regarding profitability and operational efficiency remain concerning. Investors should approach with caution, as the overall outlook suggests that the company still faces significant challenges ahead.

View full answer

Should I buy, sell or hold Vivanta Industries Ltd?

14-Feb-2026

When is the next results date for Vivanta Industries Ltd?

05-May-2026

The next results date for Vivanta Industries Ltd is 08 May 2026.

The next results date for Vivanta Industries Ltd is scheduled for 08 May 2026.

View full answer

Why is Vivanta Industries Ltd falling/rising?

06-May-2026

As of 05-May, Vivanta Industries Ltd's stock price is stable at 1.91, with a short-term gain of 1.06% over the past week but a year-to-date decline of 4.50% and a significant drop of 32.51% over the past year. The stock shows mixed signals with declining investor participation, which may impact future price movements.

As of 05-May, Vivanta Industries Ltd's stock price is currently stable at 1.91, showing no change (0.00%). The stock has demonstrated a positive performance over the past week, rising by 1.06%, and has significantly outperformed the benchmark Sensex, which only increased by 0.17%. Over the past month, the stock has risen by 15.06%, while the Sensex has gained 5.04%. <BR><BR>However, despite these short-term gains, the stock has experienced a decline of 4.50% year-to-date and a substantial drop of 32.51% over the past year. The three-year performance shows a significant decline of 66.56%, contrasting sharply with the Sensex's increase of 26.15% during the same period. <BR><BR>Today's trading activity indicates that the stock has outperformed its sector by 0.36%. Nevertheless, there is a concerning trend of falling investor participation, as evidenced by a delivery volume of 97.05k on May 4, which has decreased by 48.15% compared to the five-day average. This decline in participation could indicate waning investor interest, which may affect future price movements. <BR><BR>In terms of liquidity, the stock remains liquid enough for trading, based on 2% of the five-day average traded value. While the stock is currently above its shorter-term moving averages (5-day, 20-day, 50-day, and 100-day), it remains below the 200-day moving average, suggesting mixed signals regarding its long-term trend. Overall, while there are short-term gains, the long-term performance and declining investor participation may contribute to a cautious outlook for Vivanta Industries Ltd.

View full answer
iScoreScore
Click here to find our call on this stock
Strong Sell
Sell
Hold
Buy
Strong Buy

Dashboard

1

Weak Long Term Fundamental Strength with a -204.06% CAGR growth in Operating Profits over the last 5 years

  • Low ability to service debt as the company has a high Debt to EBITDA ratio of -9.68 times
  • The company has been able to generate a Return on Equity (avg) of 4.22% signifying low profitability per unit of shareholders funds
2

Risky - Negative EBITDA

3

Consistent Underperformance against the benchmark over the last 3 years

stock-summaryMojo Parameters

Mojo Parameters

Loading Valuation Snapshot...

Stock DNA

stock-summary
Industry

Construction

stock-summary
Market cap

INR 24 Cr (Micro Cap)

stock-summary
P/E

NA (Loss Making)

stock-summary
Industry P/E

37

stock-summary
Dividend Yield

0.00%

stock-summary
Debt Equity

1.03

stock-summary
Return on Equity

-8.63%

stock-summary
Price to Book

1.46

Revenue and Profits:
Net Sales:
67 Cr
(Quarterly Results - Dec 2025)
Net Profit:
1 Cr
stock-summaryTotal Returns
Total Returns (Price + Dividend) stock-summary
Dividend Yield (0%)
TimePeriod
Price Return
Dividend Return
Total Return
3 Months
5.62%
0%
5.62%
6 Months
-15.32%
0%
-15.32%
1 Year
-32.13%
0%
-32.13%
2 Years
-57.56%
0%
-57.56%
3 Years
-67.09%
0.62%
-66.47%
4 Years
34.29%
2.21%
36.5%
5 Years
206.39%
2.54%
208.93%

Latest dividend: 0.03 per share ex-dividend date: Sep-05-2023

Risk Adjusted Returns v/s stock-summary
Returns Beta
Icon
Beta has not been calculated since enough price history is not available
stock-summaryNews & Corporate Actions

Announcements stock-summary

Board Meeting Intimation for Intimation Under Regulation 29(1)(A) And 30 Of SEBI (Listing Obligations And Disclosure Requirements) Regulations 2015

04-May-2026 | Source : BSE

Vivanta Industries Ltdhas informed BSE that the meeting of the Board of Directors of the Company is scheduled on 08/05/2026 inter alia to consider and approve Pursuant to Regulation 29(1)(a) and Regulation 30 of the SEBI (Listing Obligations and Disclosure Requirements) Regulations 2015 Notice is hereby given that a meeting of the Board of Directors of the Company is scheduled to be held on Friday 8th May 2026 at 05:00 P.M. at the Registered Office of the Company to transact the business mentioned in the attached Intimation letter

Intimation Under Regulation 30 Of The Securities And Exchange Board Of India (Listing Obligations And Disclosure Requirements) Regulations 2015 - Appointment Of Nodal Officer Under IEPF (Accounting Audit Transfer And Refund) Rules 2016.

20-Apr-2026 | Source : BSE

In Compliance with provisions of Section 124 readwith Rule 7(2A) of Investor Education and Protection Fund Authority (Accounting Audit Transfer and Refund) Rules 2016 we hereby inform that the Board of Directors of the Company has by way of Circular Resolution passed on April 20th 2026 approved the appointment of Mr. Devang Shah Company Secretary and Compliance Officer of the Company as the Nodal Officer for the purpose of verification of claims and coordination with the Investor Education and Protection Fund Authority with effect from April 20th 2026

Compliances-Certificate under Reg. 74 (5) of SEBI (DP) Regulations 2018

16-Apr-2026 | Source : BSE

We submit herewith the confirmation certificate received from M/s. Purva Sharegistry (I) Private Limited. Registrar and Share Transfer Agent (RTA) of the Company as per Regulation 74(5) of the SEBI (Depositories and Participants) Regulations 2018 for the Quarter and Year ended on 31st March 2026

Corporate Actions stock-summary

stock-summary
BOARD MEETING

08 May 2026

stock-summary
DIVIDEND

Vivanta Industries Ltd has declared 3% dividend, ex-date: 05 Sep 23

stock-summary
SPLITS

Vivanta Industries Ltd has announced 1:10 stock split, ex-date: 17 Mar 23

stock-summary
BONUS

Vivanta Industries Ltd has announced 1:4 bonus issue, ex-date: 05 Sep 23

stock-summary
RIGHTS

No Rights history available

stock-summaryKey Factors

Quality key factors stock-summary

Factor
Value
Sales Growth (5y)
215.85%
EBIT Growth (5y)
-204.06%
EBIT to Interest (avg)
0.04
Debt to EBITDA (avg)
Negative Net Debt
Net Debt to Equity (avg)
1.03
Sales to Capital Employed (avg)
1.44
Tax Ratio
4.00%
Dividend Payout Ratio
0
Pledged Shares
0
Institutional Holding
0
ROCE (avg)
0.36%
ROE (avg)
4.22%

Valuation key factors

Factor
Value
P/E Ratio
NA (Loss Making)
Industry P/E
37
Price to Book Value
1.45
EV to EBIT
-17.29
EV to EBITDA
-19.28
EV to Capital Employed
1.22
EV to Sales
0.13
PEG Ratio
NA
Dividend Yield
NA
ROCE (Latest)
-6.74%
ROE (Latest)
-8.63%

Technicals key factors

Indicator
Weekly
Monthly
MACD
Mildly Bullish
Bearish
RSI
No Signal
Bearish
Bollinger Bands
Mildly Bullish
Bearish
Moving Averages
Mildly Bearish (Daily)
KST
Mildly Bullish
Bearish
Dow Theory
No Trend
No Trend
stock-summary Technical Indicator Scale: Bearish, Mildly Bearish, Sideways, Mildly Bullish, Bullish  Turned 
stock-summaryShareholding
Shareholding Snapshot : Mar 2026stock-summary
Shareholding Compare (%holding) stock-summary
Majority shareholders

Non Institution

Pledged Promoter Holdings

None

Mutual Funds

Held by 0 Schemes

FIIs

Held by 0 FIIs

Promoter with highest holding

Parth Hemant Parikh (7.02%)

Highest Public shareholder

Jayntibhai Hirdas Patel (1.69%)

Individual Investors Holdings

85.83%

stock-summaryFinancial
[
  {
    "link": "quarterly",
    "btn_text": "All Quarterly Results",
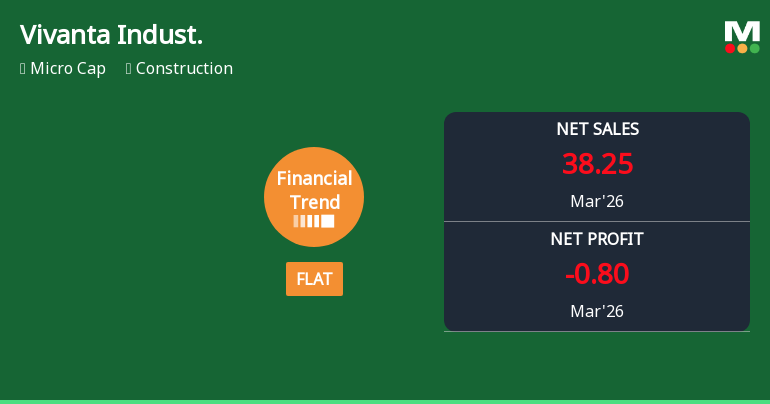
    "header": "Quarterly Results Snapshot (Consolidated) - Dec'25 - QoQ",
    "rhs": [
      {
        "prefix": "Net Sales ",
        "suffix": "QoQ Growth in quarter ended Dec 2025 is -2.44% vs -9.32% in Sep 2025",
        "dir": 1
      },
      {
        "prefix": "Consolidated Net Profit ",
        "suffix": "QoQ Growth in quarter ended Dec 2025 is 426.32% vs -171.70% in Sep 2025",
        "dir": 1
      }
    ],
    "table": {
      "header": [
        "Dec'25",
        "Sep'25",
        "Change(%)"
      ],
      "body": [
        {
          "field": "Net Sales",
          "val1": "67.14",
          "val2": "68.82",
          "chgp": "-2.44%",
          "chgp_class": "negative"
        },
        {
          "field": "Operating Profit (PBDIT) excl Other Income",
          "val1": "0.01",
          "val2": "-0.57",
          "chgp": "101.75%",
          "chgp_class": "positive"
        },
        {
          "field": "Interest",
          "val1": "0.02",
          "val2": "-0.01",
          "chgp": "300.00%",
          "chgp_class": "negative"
        },
        {
          "field": "Exceptional Items",
          "val1": "0.00",
          "val2": "0.00",
          "chgp": "",
          "chgp_class": "neutral"
        },
        {
          "field": "Consolidate Net Profit",
          "val1": "1.24",
          "val2": "-0.38",
          "chgp": "426.32%",
          "chgp_class": "positive"
        },
        {
          "field": "Operating Profit Margin (Excl OI)",
          "val1": "0.01%",
          "val2": "-0.83%",
          "chgp": "0.84%",
          "chgp_class": "positive"
        }
      ]
    }
  },
  {
    "link": "half-yearly",
    "btn_text": "All Half Yearly Results",
    "header": "Half Yearly Results Snapshot (Consolidated) - Sep'25",
    "rhs": [
      {
        "prefix": "Net Sales ",
        "suffix": " Growth in half year ended Sep 2025 is 2,883.51% vs -78.94% in Sep 2024",
        "dir": 1
      },
      {
        "prefix": "Consolidated Net Profit ",
        "suffix": " Growth in half year ended Sep 2025 is -40.74% vs -73.27% in Sep 2024",
        "dir": 1
      }
    ],
    "table": {
      "header": [
        "Sep'25",
        "Sep'24",
        "Change(%)"
      ],
      "body": [
        {
          "field": "Net Sales",
          "val1": "144.70",
          "val2": "4.85",
          "chgp": "2,883.51%",
          "chgp_class": "positive"
        },
        {
          "field": "Operating Profit (PBDIT) excl Other Income",
          "val1": "-0.62",
          "val2": "-0.01",
          "chgp": "-6,100.00%",
          "chgp_class": "negative"
        },
        {
          "field": "Interest",
          "val1": "0.03",
          "val2": "0.02",
          "chgp": "50.00%",
          "chgp_class": "negative"
        },
        {
          "field": "Exceptional Items",
          "val1": "0.00",
          "val2": "0.00",
          "chgp": "",
          "chgp_class": "neutral"
        },
        {
          "field": "Consolidate Net Profit",
          "val1": "0.16",
          "val2": "0.27",
          "chgp": "-40.74%",
          "chgp_class": "negative"
        },
        {
          "field": "Operating Profit Margin (Excl OI)",
          "val1": "-0.43%",
          "val2": "-0.21%",
          "chgp": "-0.22%",
          "chgp_class": "negative"
        }
      ]
    }
  },
  {
    "link": "nine-monthly",
    "btn_text": "All Nine Monthly Results",
    "header": "Nine Monthly Results Snapshot (Consolidated) - Dec'25",
    "rhs": [
      {
        "prefix": "Net Sales ",
        "suffix": "YoY Growth in nine months ended Dec 2025 is 2,568.01% vs -76.02% in Dec 2024",
        "dir": 1
      },
      {
        "prefix": "Consolidated Net Profit ",
        "suffix": "YoY Growth in nine months ended Dec 2025 is 351.61% vs -75.97% in Dec 2024",
        "dir": 1
      }
    ],
    "table": {
      "header": [
        "Dec'25",
        "Dec'24",
        "Change(%)"
      ],
      "body": [
        {
          "field": "Net Sales",
          "val1": "211.84",
          "val2": "7.94",
          "chgp": "2,568.01%",
          "chgp_class": "positive"
        },
        {
          "field": "Operating Profit (PBDIT) excl Other Income",
          "val1": "-0.61",
          "val2": "0.17",
          "chgp": "-458.82%",
          "chgp_class": "negative"
        },
        {
          "field": "Interest",
          "val1": "0.05",
          "val2": "0.06",
          "chgp": "-16.67%",
          "chgp_class": "positive"
        },
        {
          "field": "Exceptional Items",
          "val1": "0.00",
          "val2": "0.00",
          "chgp": "",
          "chgp_class": "neutral"
        },
        {
          "field": "Consolidate Net Profit",
          "val1": "1.40",
          "val2": "0.31",
          "chgp": "351.61%",
          "chgp_class": "positive"
        },
        {
          "field": "Operating Profit Margin (Excl OI)",
          "val1": "-0.29%",
          "val2": "2.14%",
          "chgp": "-2.43%",
          "chgp_class": "negative"
        }
      ]
    }
  },
  {
    "link": "annual",
    "btn_text": "All Annual Results",
    "header": "Annual Results Snapshot (Consolidated) - Mar'25",
    "rhs": [
      {
        "prefix": "Net Sales ",
        "suffix": "YoY Growth in year ended Mar 2025 is 194.84% vs 50.22% in Mar 2024",
        "dir": 1
      },
      {
        "prefix": "Consolidated Net Profit ",
        "suffix": "YoY Growth in year ended Mar 2025 is -241.94% vs -28.46% in Mar 2024",
        "dir": -1
      }
    ],
    "table": {
      "header": [
        "Mar'25",
        "Mar'24",
        "Change(%)"
      ],
      "body": [
        {
          "field": "Net Sales",
          "val1": "109.80",
          "val2": "37.24",
          "chgp": "194.84%",
          "chgp_class": "positive"
        },
        {
          "field": "Operating Profit (PBDIT) excl Other Income",
          "val1": "-1.40",
          "val2": "1.45",
          "chgp": "-196.55%",
          "chgp_class": "negative"
        },
        {
          "field": "Interest",
          "val1": "0.08",
          "val2": "0.03",
          "chgp": "166.67%",
          "chgp_class": "negative"
        },
        {
          "field": "Exceptional Items",
          "val1": "0.00",
          "val2": "0.00",
          "chgp": "",
          "chgp_class": "neutral"
        },
        {
          "field": "Consolidate Net Profit",
          "val1": "-1.32",
          "val2": "0.93",
          "chgp": "-241.94%",
          "chgp_class": "negative"
        },
        {
          "field": "Operating Profit Margin (Excl OI)",
          "val1": "-1.28%",
          "val2": "3.89%",
          "chgp": "-5.17%",
          "chgp_class": "negative"
        }
      ]
    }
  }
]

Quarterly Results Snapshot (Consolidated) - Dec'25 - QoQstock-summary

Dec'25
Sep'25
Change(%)
Net Sales
67.14
68.82
-2.44%
Operating Profit (PBDIT) excl Other Income
0.01
-0.57
101.75%
Interest
0.02
-0.01
300.00%
Exceptional Items
0.00
0.00
Consolidate Net Profit
1.24
-0.38
426.32%
Operating Profit Margin (Excl OI)
0.01%
-0.83%
0.84%
Values in Rs Cr.
Direction Arrows
Net Sales

QoQ Growth in quarter ended Dec 2025 is -2.44% vs -9.32% in Sep 2025

Direction Arrows
Consolidated Net Profit

QoQ Growth in quarter ended Dec 2025 is 426.32% vs -171.70% in Sep 2025

Half Yearly Results Snapshot (Consolidated) - Sep'25stock-summary

Sep'25
Sep'24
Change(%)
Net Sales
144.70
4.85
2,883.51%
Operating Profit (PBDIT) excl Other Income
-0.62
-0.01
-6,100.00%
Interest
0.03
0.02
50.00%
Exceptional Items
0.00
0.00
Consolidate Net Profit
0.16
0.27
-40.74%
Operating Profit Margin (Excl OI)
-0.43%
-0.21%
-0.22%
Values in Rs Cr.
Direction Arrows
Net Sales

Growth in half year ended Sep 2025 is 2,883.51% vs -78.94% in Sep 2024

Direction Arrows
Consolidated Net Profit

Growth in half year ended Sep 2025 is -40.74% vs -73.27% in Sep 2024

Nine Monthly Results Snapshot (Consolidated) - Dec'25stock-summary

Dec'25
Dec'24
Change(%)
Net Sales
211.84
7.94
2,568.01%
Operating Profit (PBDIT) excl Other Income
-0.61
0.17
-458.82%
Interest
0.05
0.06
-16.67%
Exceptional Items
0.00
0.00
Consolidate Net Profit
1.40
0.31
351.61%
Operating Profit Margin (Excl OI)
-0.29%
2.14%
-2.43%
Values in Rs Cr.
Direction Arrows
Net Sales

YoY Growth in nine months ended Dec 2025 is 2,568.01% vs -76.02% in Dec 2024

Direction Arrows
Consolidated Net Profit

YoY Growth in nine months ended Dec 2025 is 351.61% vs -75.97% in Dec 2024

Annual Results Snapshot (Consolidated) - Mar'25stock-summary

Mar'25
Mar'24
Change(%)
Net Sales
109.80
37.24
194.84%
Operating Profit (PBDIT) excl Other Income
-1.40
1.45
-196.55%
Interest
0.08
0.03
166.67%
Exceptional Items
0.00
0.00
Consolidate Net Profit
-1.32
0.93
-241.94%
Operating Profit Margin (Excl OI)
-1.28%
3.89%
-5.17%
Values in Rs Cr.
Direction Arrows
Net Sales

YoY Growth in year ended Mar 2025 is 194.84% vs 50.22% in Mar 2024

Direction Arrows
Consolidated Net Profit

YoY Growth in year ended Mar 2025 is -241.94% vs -28.46% in Mar 2024

stock-summaryCompany CV
About Vivanta Industries Ltd stock-summary
stock-summary
Vivanta Industries Ltd
Micro Cap
Construction
Vivanta Industries Limited (VIL) was initially registered as a Private Limited Company in the name of 'Vernes Infotech Private Limited' with the Registrar of Companies, Gujarat on May 31, 2013. The Company status was converted to a Public Limited Company and the name was changed to 'Vernes Infotech Limited' and further to 'Vivanta Industries Limited' on March 31, 2017. Initially, the Company engaged in trading of various steel products, electronic items and dealing in shares & security.
Company Coordinates stock-summary
Company Details
403/TF Sarthik II Opp Rajpath, Club SG Highway Bodakdev Ahmedabad Gujarat : 380054
stock-summary
Tel: 91-079-26870952
stock-summary
business@vivantaindustries.com
Registrar Details