
Compare Vivimed Labs. with Similar Stocks
Dashboard
With HIgh Debt (Debt-Equity Ratio at 9.51 times)- the company has a Weak Long Term Fundamental Strength
- Low ability to service debt as the company has a high Debt to EBITDA ratio of -2.02 times
- The company has reported losses. Due to this company has reported negative ROE
Flat results in Dec 25
Risky - Negative EBITDA
Stock DNA
Pharmaceuticals & Drugs
INR 50 Cr (Micro Cap)
NA (Loss Making)
34
0.00%
9.51
-833.41%
1.32
Total Returns (Price + Dividend) 
Latest dividend: 0.4 per share ex-dividend date: Sep-19-2018
Risk Adjusted Returns v/s
Returns Beta

News
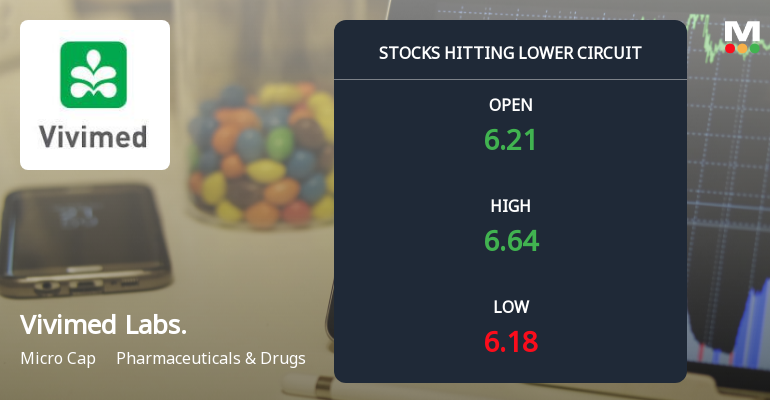
Vivimed Labs Ltd Locks at Lower Circuit With 5% Loss — Sellers Queue, No Buyers in Sight
At Rs 6.08, sellers were still queuing — but there were no buyers willing to take the other side. Vivimed Labs Ltd locked at its lower circuit of 5% on 8 Jun 2026, with unfilled sell orders and a frozen price, signalling a pronounced imbalance between supply and demand.
Read full news article
Vivimed Labs Ltd is Rated Strong Sell
Vivimed Labs Ltd is rated Strong Sell by MarketsMOJO, with this rating last updated on 12 May 2026. However, the analysis and financial metrics discussed here reflect the stock’s current position as of 08 June 2026, providing investors with the latest insights into its performance and outlook.
Read full news article
Vivimed Labs Ltd Locks at Upper Circuit With 1.4% Gain — Buyers Queue, Sellers Absent
At Rs 6.77, the buying was done — not because demand dried up, but because the exchange wouldn't let the stock go any higher. Vivimed Labs Ltd locked at its upper circuit of 5% on 29 May 2026, with buyers queuing and no sellers willing to part with shares.
Read full news article Announcements
Board Meeting Postponed
30-May-2026 | Source : BSEBoard meeting Postponed
Update on board meeting
26-May-2026 | Source : BSEThe Board Meeting to be held on 28/05/2026 has been revised to 30/05/2026 The Board Meeting to be held on 28/05/2026 has been revised to 30/05/2026
Compliances-Reg.24(A)-Annual Secretarial Compliance
19-May-2026 | Source : BSEannual secretarial compliance report
Corporate Actions

No Upcoming Board Meetings

Vivimed Labs Ltd has declared 20% dividend, ex-date: 19 Sep 18

Vivimed Labs Ltd has announced 2:10 stock split, ex-date: 06 Apr 16

No Bonus history available

No Rights history available
Quality key factors
Valuation key factors
Technicals key factors
 Technical Indicator Scale: Bearish, Mildly Bearish, Sideways, Mildly Bullish, Bullish Turned
 Shareholding Snapshot : Mar 2026
Shareholding Compare (%holding)
Non Institution
15.1806
Held by 0 Schemes
Held by 5 FIIs (1.64%)
Varalwar Sandeep (2.81%)
Kitara Piin 1102 (9.37%)
68.75%
Quarterly Results Snapshot (Standalone) - Dec'25 - QoQ
Not Applicable: The company has declared_date for only one period
Not Applicable: The company has declared_date for only one period
Half Yearly Results Snapshot (Consolidated) - Sep'22

Growth in half year ended Sep 2022 is -21.15% vs -78.03% in Sep 2021
Growth in half year ended Sep 2022 is -72.57% vs -3,185.90% in Sep 2021
Nine Monthly Results Snapshot (Consolidated) - Dec'22
YoY Growth in nine months ended Dec 2022 is -14.81% vs -78.58% in Dec 2021

YoY Growth in nine months ended Dec 2022 is -26.83% vs 2.03% in Dec 2021
Annual Results Snapshot (Consolidated) - Mar'25
YoY Growth in year ended Mar 2025 is -37.86% vs -21.15% in Mar 2023
YoY Growth in year ended Mar 2025 is 90.27% vs -385.63% in Mar 2023
About Vivimed Labs Ltd

Company Coordinates


