
Compare Viyash Scientifi with Similar Stocks
Dashboard
Weak Long Term Fundamental Strength with an average Return on Capital Employed (ROCE) of 5.81%
- Poor long term growth as Operating profit has grown by an annual rate 18.70% of over the last 5 years
With a growth in Net Profit of 539.5%, the company declared Outstanding results in Mar 26
With ROE of 6.5, it has a Expensive valuation with a 4.1 Price to Book Value
Majority shareholders : Promoters
Market Beating performance in long term as well as near term
Stock DNA
Pharmaceuticals & Biotechnology
INR 11,861 Cr (Small Cap)
63.00
35
0.00%
0.08
6.50%
4.08
Total Returns (Price + Dividend) 
Latest dividend: 0.5 per share ex-dividend date: Sep-08-2021
Risk Adjusted Returns v/s
Returns Beta

News

Viyash Scientific Ltd is Rated Hold by MarketsMOJO
Viyash Scientific Ltd is rated 'Hold' by MarketsMOJO, a rating that was last updated on 11 May 2026. While this rating change occurred in early May, the analysis and financial metrics discussed here reflect the company’s current position as of 25 June 2026, providing investors with an up-to-date view of the stock’s fundamentals, valuation, financial trends, and technical outlook.
Read full news article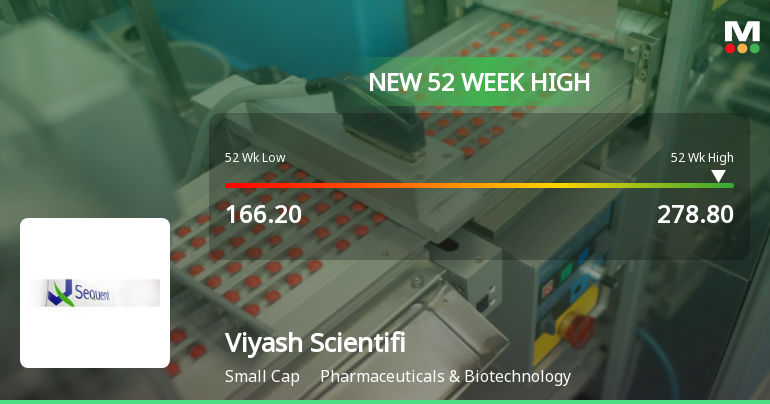
Broad-Based Technical Strength Lifts Viyash Scientific Ltd to 52-Week High of Rs 278.8
With a sustained four-day rally culminating in a fresh 52-week high of Rs 278.8 on 23 Jun 2026, Viyash Scientific Ltd has demonstrated impressive price momentum, outperforming the broader market and its sector peers in the Pharmaceuticals & Biotechnology space.
Read full news article
Viyash Scientific Ltd is Rated Hold
Viyash Scientific Ltd is rated 'Hold' by MarketsMOJO, with this rating last updated on 11 May 2026. However, the analysis and financial metrics discussed here reflect the stock's current position as of 14 June 2026, providing investors with an up-to-date view of its performance and outlook.
Read full news article Announcements
Announcement under Regulation 30 (LODR)-Analyst / Investor Meet - Intimation
17-Jun-2026 | Source : BSEInvestor meeting -Viyash Investor Day - 2026
Announcement under Regulation 30 (LODR)-Analyst / Investor Meet - Outcome
11-Jun-2026 | Source : BSEEarning call Audio Recording
Announcement under Regulation 30 (LODR)-Press Release / Media Release
08-Jun-2026 | Source : BSEPress Release
Corporate Actions

No Upcoming Board Meetings

Viyash Scientific Ltd has declared 25% dividend, ex-date: 08 Sep 21

Viyash Scientific Ltd has announced 2:10 stock split, ex-date: 25 Feb 16

No Bonus history available

No Rights history available
Quality key factors
Valuation key factors
Technicals key factors
 Technical Indicator Scale: Bearish, Mildly Bearish, Sideways, Mildly Bullish, Bullish Turned
 Shareholding Snapshot : Mar 2026
Shareholding Compare (%holding)
Promoters
None
Held by 7 Schemes (6.44%)
Held by 29 FIIs (2.94%)
Ca Hull Investments (31.17%)
Quant Mutual Fund - Quant Manufacturing Fund (6.09%)
18.97%
Quarterly Results Snapshot (Consolidated) - Mar'26 - YoY

YoY Growth in quarter ended Mar 2026 is 129.02% vs 11.21% in Mar 2025

YoY Growth in quarter ended Mar 2026 is 459.12% vs 1,113.04% in Mar 2025
Half Yearly Results Snapshot (Consolidated) - Sep'25
Growth in half year ended Sep 2025 is 14.04% vs 11.73% in Sep 2024
Growth in half year ended Sep 2025 is 218.53% vs 121.10% in Sep 2024
Nine Monthly Results Snapshot (Consolidated) - Dec'25
YoY Growth in nine months ended Dec 2025 is 12.46% vs 51.99% in Dec 2024
YoY Growth in nine months ended Dec 2025 is 25.61% vs 253.69% in Dec 2024
Annual Results Snapshot (Consolidated) - Mar'26
YoY Growth in year ended Mar 2026 is 13.75% vs 119.52% in Mar 2025
YoY Growth in year ended Mar 2026 is 663.48% vs 164.72% in Mar 2025
About Viyash Scientific Ltd

Company Coordinates


