
Compare VMS Industries with Similar Stocks
Dashboard
With a Operating Losses, the company has a Weak Long Term Fundamental Strength
- Company's ability to service its debt is weak with a poor EBIT to Interest (avg) ratio of 0.62
- The company has been able to generate a Return on Equity (avg) of 4.95% signifying low profitability per unit of shareholders funds
Negative results in Mar 26
Risky - Negative EBITDA
47.63% of Promoter Shares are Pledged
Underperformed the market in the last 1 year
Stock DNA
Transport Infrastructure
INR 54 Cr (Micro Cap)
38.00
32
0.00%
0.14
1.50%
0.57
Total Returns (Price + Dividend) 
Latest dividend: 0.5 per share ex-dividend date: Jul-12-2024
Risk Adjusted Returns v/s
Returns Beta

News

VMS Industries Ltd is Rated Strong Sell
VMS Industries Ltd is rated Strong Sell by MarketsMOJO, with this rating last updated on 13 August 2025. However, the analysis and financial metrics discussed here reflect the stock’s current position as of 17 June 2026, providing investors with an up-to-date view of the company’s fundamentals, valuation, financial trend, and technical outlook.
Read full news article
VMS Industries Ltd is Rated Strong Sell
VMS Industries Ltd is rated Strong Sell by MarketsMOJO, with this rating last updated on 13 Aug 2025. However, the analysis and financial metrics discussed here reflect the company’s current position as of 04 June 2026, providing investors with an up-to-date view of its fundamentals, valuation, financial trend, and technical outlook.
Read full news article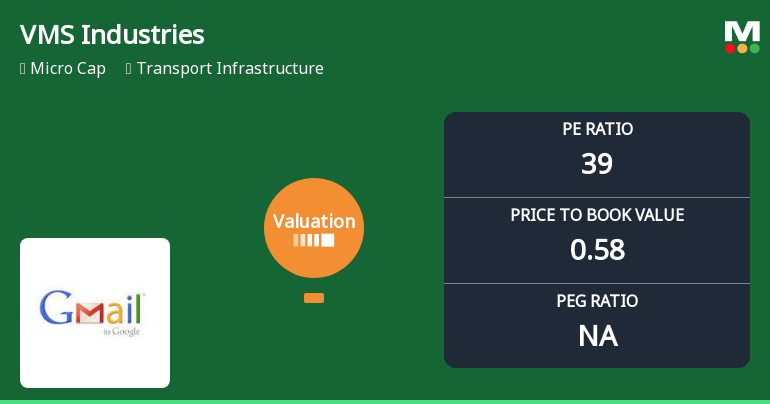
VMS Industries Ltd Faces Valuation Shift Amidst Risky Market Sentiment
VMS Industries Ltd, a micro-cap player in the transport infrastructure sector, has seen a marked deterioration in its valuation parameters, shifting from a previously attractive profile to a risky one. With a current price of ₹23.18, down 3.74% on the day, the company’s price-to-earnings (P/E) ratio has surged to 38.84, while its price-to-book value (P/BV) remains low at 0.58, signalling a complex valuation landscape that warrants close investor scrutiny.
Read full news article Announcements
News Paper Publication Of Result For Financial Period Ended On 31.03.2026
29-May-2026 | Source : BSENews paper publication of result for financial period ended on 31.03.2026 with 4th quarter ended on 31.03.2026 published in news papers
Results For 4Th Quarter Ended On 31.03.2026 With Audited Results For Financial Year Ended On 31.03.2026
28-May-2026 | Source : BSEattached
Board Meeting Outcome for Outcome Of Board Meeting Held On 28.05.2026 For Approval Of Fy 2025-26 With 4Th Quarter Ended 31.03.2026
28-May-2026 | Source : BSEOutcome of Board Meeting held on 28.05.2026 for approval of Fy 2025-26 with 4th quarter ended 31.03.2026
Corporate Actions

No Upcoming Board Meetings

VMS Industries Ltd has declared 5% dividend, ex-date: 12 Jul 24

No Splits history available

No Bonus history available

VMS Industries Ltd has announced 16:33 rights issue, ex-date: 18 Apr 24
Quality key factors
Valuation key factors
Technicals key factors
 Technical Indicator Scale: Bearish, Mildly Bearish, Sideways, Mildly Bullish, Bullish Turned
 Shareholding Snapshot : Mar 2026
Shareholding Compare (%holding)
Non Institution
47.6347
Held by 0 Schemes
Held by 1 FIIs (0.37%)
Manojkumar Jain (25.2%)
Uma Maheswari (3.05%)
57.34%
Quarterly Results Snapshot (Standalone) - Mar'26 - YoY

YoY Growth in quarter ended Mar 2026 is -3.45% vs -43.15% in Mar 2025

YoY Growth in quarter ended Mar 2026 is -94.16% vs 272.46% in Mar 2025
Half Yearly Results Snapshot (Standalone) - Sep'25
Growth in half year ended Sep 2025 is -59.48% vs 100.99% in Sep 2024
Growth in half year ended Sep 2025 is -32.33% vs -35.12% in Sep 2024
Nine Monthly Results Snapshot (Standalone) - Dec'25
YoY Growth in nine months ended Dec 2025 is -54.69% vs 35.32% in Dec 2024
YoY Growth in nine months ended Dec 2025 is -30.54% vs -66.13% in Dec 2024
Annual Results Snapshot (Standalone) - Mar'26
YoY Growth in year ended Mar 2026 is -45.44% vs 8.33% in Mar 2025
YoY Growth in year ended Mar 2026 is -78.53% vs 7.59% in Mar 2025
About VMS Industries Ltd

Company Coordinates


