
Compare W H Brady with Similar Stocks
Dashboard
Poor Management Efficiency with a low ROE of 9.09%
- The company has been able to generate a Return on Equity (avg) of 9.09% signifying low profitability per unit of shareholders funds
Poor long term growth as Operating profit has grown by an annual rate -13.52% of over the last 5 years
Flat results in Mar 26
Below par performance in long term as well as near term
Stock DNA
Other Industrial Products
INR 146 Cr (Micro Cap)
28.00
23
0.00%
-0.29
5.73%
1.61
Total Returns (Price + Dividend) 
Latest dividend: 0.7 per share ex-dividend date: Aug-05-2016
Risk Adjusted Returns v/s
Returns Beta

News

W H Brady & Co Ltd is Rated Sell
W H Brady & Co Ltd is rated Sell by MarketsMOJO, with this rating last updated on 14 February 2026. However, the analysis and financial metrics discussed here reflect the company’s current position as of 15 June 2026, providing investors with an up-to-date view of the stock’s fundamentals, returns, and technical outlook.
Read full news article
W H Brady & Co Ltd is Rated Sell
W H Brady & Co Ltd is rated 'Sell' by MarketsMOJO, with this rating last updated on 14 February 2026. However, the analysis and financial metrics discussed here reflect the stock's current position as of 01 June 2026, providing investors with an up-to-date view of the company’s fundamentals, returns, and technical outlook.
Read full news article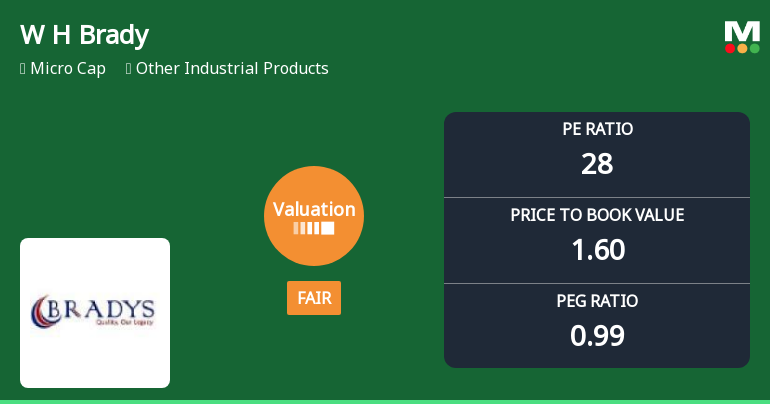
W H Brady & Co Ltd Valuation Shifts Signal Renewed Price Attractiveness Amid Market Volatility
W H Brady & Co Ltd has experienced a notable shift in its valuation parameters, moving from a very expensive rating to a fair valuation grade. This change reflects evolving market perceptions amid fluctuating financial metrics and peer comparisons within the Other Industrial Products sector. Despite a recent decline in share price, the company’s valuation multiples now present a more balanced picture for investors assessing its price attractiveness relative to historical and sector benchmarks.
Read full news article Announcements
Announcement under Regulation 30 (LODR)-Newspaper Publication
29-May-2026 | Source : BSENewspaper Publication of Financial Results for the Quarter ended March 31 2026
Compliances-Reg.24(A)-Annual Secretarial Compliance
29-May-2026 | Source : BSEAnnual Secretarial Compliance Report for the FY ended March 31 2026.
Board Meeting Intimation for Approval Of Audited Financial Results (Standalone And Consolidated For The Quarter And Year Ended March 31 2026.
22-May-2026 | Source : BSEWH Brady & Company Ltdhas informed BSE that the meeting of the Board of Directors of the Company is scheduled on 27/05/2026 inter alia to consider and approve 1)To consider and approve Audited Financial Results (Standalone & Consolidated) as recommended by the Audit Committee for the quarter and year ended March 31 2026. 2)Any other matter with the permission of the Chair.
Corporate Actions

No Upcoming Board Meetings

W H Brady & Co Ltd has declared 7% dividend, ex-date: 05 Aug 16

No Splits history available

W H Brady & Co Ltd has announced 1:2 bonus issue, ex-date: 03 Jan 08

No Rights history available
Quality key factors
Valuation key factors
Technicals key factors
 Technical Indicator Scale: Bearish, Mildly Bearish, Sideways, Mildly Bullish, Bullish Turned
 Shareholding Snapshot : Mar 2026
Shareholding Compare (%holding)
Promoters
None
Held by 1 Schemes (0.06%)
Held by 0 FIIs
Shivum Holdings Pvt. Ltd. (39.44%)
Spark Online Pvt Ltd (3.44%)
13.32%
Quarterly Results Snapshot (Consolidated) - Mar'26 - QoQ

QoQ Growth in quarter ended Mar 2026 is -21.16% vs 60.26% in Dec 2025
QoQ Growth in quarter ended Mar 2026 is -124.57% vs 132.00% in Dec 2025
Half Yearly Results Snapshot (Consolidated) - Sep'25
Growth in half year ended Sep 2025 is -21.13% vs 40.11% in Sep 2024
Growth in half year ended Sep 2025 is -49.21% vs 41.26% in Sep 2024
Nine Monthly Results Snapshot (Consolidated) - Dec'25
YoY Growth in nine months ended Dec 2025 is -9.83% vs 25.98% in Dec 2024
YoY Growth in nine months ended Dec 2025 is -38.26% vs 37.12% in Dec 2024
Annual Results Snapshot (Consolidated) - Mar'26
YoY Growth in year ended Mar 2026 is -15.76% vs 17.50% in Mar 2025
YoY Growth in year ended Mar 2026 is -76.01% vs 130.25% in Mar 2025
About W H Brady & Co Ltd

Company Coordinates


