Waaree Renewab.

INR
883.65
-25.35 (-2.79%)
BSENSE

Jan 20

BSE+NSE Vol: 5.51 lacs

  • Price Points
  • Score
  • Mojo Parameters
  • Total Return
  • News and Corporate Actions
  • Key factors
  • Shareholding
  • Financials
  • CompanyCV
stock-summaryPrice Point
High/Low

1Day

52 Week

Valuation
Technical
Day's Volume

CASH

5.51 lacs (-57.68%) Volume

Shareholding (Dec 2025)

FII

1.70%

Held by 70 FIIs

DII

0.05%

Held by 0 DIIs

Promoter

74.32%

Who are the top shareholders of the Waaree Renewab.?

06-Jun-2025

The top shareholder of Waaree Renewab is Waaree Energies Limited, owning 74.39% of the shares. Individual investors hold 19.57%, with Hitesh P Mehta as the largest public shareholder at 1.06%, while 47 foreign institutional investors own a combined 1.13%.

The top shareholders of Waaree Renewab include Waaree Energies Limited, which holds the largest share at 74.39%. Individual investors collectively own 19.57% of the company, with the highest public shareholder being Hitesh P Mehta, who holds 1.06%. Additionally, 47 foreign institutional investors (FIIs) hold a combined 1.13% of the shares. There are no pledged promoter holdings, and no mutual funds are involved in the company's shareholding.

View full answer

Who are in the management team of Waaree Renewab.?

06-Jun-2025

As of March 2022, the management team of Waaree Renewab includes Nilesh Gandhi (Chairman), Pujan Pankaj Doshi (Managing Director), Hitesh Pranjivan Mehta (CFO), and several independent and non-executive directors. This diverse team oversees the company's governance and strategic direction.

As of March 2022, the management team of Waaree Renewab includes the following individuals:<BR><BR>1. Nilesh Gandhi - Chairman & Independent Director<BR>2. Mitul Mehta - Independent Non-Executive Director<BR>3. Anita Jaiswal - Independent Non-Executive Director<BR>4. Pujan Pankaj Doshi - Executive Director & Managing Director<BR>5. Hitesh Pranjivan Mehta - Executive Director & Chief Financial Officer<BR>6. Viren Doshi Chimanlal - Executive Director<BR>7. Sunil Nankishor Rathi - Non-Executive & Non-Independent Director<BR><BR>This team comprises a mix of executive and non-executive directors, contributing to the governance and strategic direction of the company.

View full answer

What does Waaree Renewab. do?

06-Jun-2025

Waaree Renewables Technologies Ltd is a mid-cap company in the power industry, specializing in renewable energy. As of March 2025, it reported net sales of ₹477 Cr and a net profit of ₹94 Cr, with a market cap of ₹10,843 Cr.

Overview:<BR>Waaree Renewables Technologies Ltd operates in the power industry and is categorized as a mid-cap company.<BR><BR>History:<BR>The company was originally incorporated in 1999 as Sangam Renewables Limited and was converted into a public company on November 18, 2011. It changed its name to Waaree Renewables Technologies Ltd on July 19, 2021. The latest quarterly results report net sales and profit for March 2025.<BR><BR>Financial Snapshot:<BR>Net Sales: 477 Cr (Quarterly Results - Mar 2025) <BR>Net Profit: 94 Cr (Quarterly Results - Mar 2025) <BR>Market Cap: Rs 10,843 Cr (Mid Cap)<BR><BR>Key Metrics:<BR>P/E: 47.00 <BR>Industry P/E: 68 <BR>Dividend Yield: 0.19% <BR>Debt-Equity: -0.48 <BR>Return on Equity: 51.00% <BR>Price to Book: 24.15 <BR><BR>Contact Details:<BR>Address: 504-B Western Edge-1, Off W/E Highway Borivali (E) Mumbai Maharashtra : 400066 <BR>Tel: 91-22-43331500 <BR>Email: info@sangamrenew.com

View full answer

What is the bonus history of the Waaree Renewab.?

06-Jun-2025

Waaree Renewables Technologies Ltd issued a bonus of 57:100 on July 21, 2014, with a record date of July 22, 2014, making shareholders on record eligible for the bonus shares.

Waaree Renewables Technologies Ltd has a bonus history that includes a bonus issue with a ratio of 57:100. This bonus was announced with an ex-date of July 21, 2014, and the record date was July 22, 2014. This means that shareholders on record as of the record date were eligible to receive the bonus shares. If you have any more questions about the company or its performance, feel free to ask!

View full answer

Has Waaree Renewab. declared dividend?

06-Jun-2025

Yes, Waaree Renewables Technologies Ltd has declared a 50% dividend, amounting to ₹1 per share, with an ex-date of January 24, 2025. While recent returns have been negative, long-term price returns over several years show significant growth.

Waaree Renewables Technologies Ltd has declared a 50% dividend.<BR><BR>Dividend Details:<BR>- Percentage announced: 50%<BR>- Amount per share: 1 per share<BR>- Ex-date: 24 Jan 25<BR><BR>Dividend Yield: 0.19%.<BR><BR>Total Returns by Period:<BR>In the last 6 months, the price return was -28.58%, the dividend return was 0.07%, resulting in a total return of -28.51%.<BR><BR>Over the past year, the price return was -55.11%, the dividend return was 0.10%, leading to a total return of -55.01%.<BR><BR>In the 2-year period, the price return was 407.0%, the dividend return was 1.46%, culminating in a total return of 408.46%.<BR><BR>For the 3-year period, the price return was 1405.38%, the dividend return was 5.79%, which resulted in a total return of 1411.17%.<BR><BR>In the last 4 years, the price return was 4391.98%, the dividend return was 14.22%, giving a total return of 4406.2%.<BR><BR>Finally, over the 5-year period, the price return was 53570.98%, the dividend return was 202.31%, leading to a total return of 53773.29%.<BR><BR>Overall, Waaree Renewables has declared a dividend, and while recent returns over shorter periods have been negative, the long-term returns over multiple years show significant growth, particularly in price returns.

View full answer

Who are the peers of the Waaree Renewab.?

03-Jun-2025

Waaree Renewab.'s peers include NTPC, Power Grid Corp, Adani Power, Adani Green, Tata Power Co., JP Power Ven., KPI Green Energy, GMR Urban, and RattanIndia Power. In terms of management risk, growth, and capital structure, Waaree Renewab. shows good performance, but its 1-year return of -58.78% is lower than GMR Urban's 64.40% and Adani Green's -50.84%.

Peers: The peers of Waaree Renewab. are NTPC, Power Grid Corpn, Adani Power, Adani Green, Tata Power Co., JP Power Ven., KPI Green Energy, GMR Urban, RattanIndia Pow.<BR><BR>Quality Snapshot: Excellent management risk is observed at Power Grid Corpn, while Average management risk is found at NTPC, Adani Power, Tata Power Co., KPI Green Energy, and the rest. Below Average management risk is noted for JP Power Ven. and RattanIndia Pow. Growth is Excellent for Adani Power, Tata Power Co., KPI Green Energy, and Waaree Renewab., while Good growth is seen at NTPC, JP Power Ven., and RattanIndia Pow. Below Average growth is present at Power Grid Corpn, and Adani Green does not qualify. Capital Structure is Good for Waaree Renewab., while Below Average is noted for NTPC, Power Grid Corpn, Adani Power, Tata Power Co., KPI Green Energy, and RattanIndia Pow. Average capital structure is found at JP Power Ven., and Adani Green and GMR Urban do not qualify.<BR><BR>Return Snapshot: The peer with the highest 1-year return is GMR Urban at 64.40%, while the lowest is Adani Green at -50.84%. Waaree Renewab.'s 1-year return is -58.78%, which is lower than both of these peers. Additionally, the six-month return is negative for NTPC, Power Grid Corpn, Adani Green, Tata Power Co., and RattanIndia Pow.

View full answer

Is Waaree Renewab. overvalued or undervalued?

09-Jun-2025

As of March 20, 2023, Waaree Renewables is considered very expensive with high valuation ratios, including a PE of 46.27 and an EV to EBITDA of 33.86, despite strong ROCE and ROE figures, and has underperformed the Sensex with a return of -54.62%.

As of 20 March 2023, the valuation grade for Waaree Renewables has moved from expensive to very expensive. The company is currently overvalued based on its high valuation ratios. The PE ratio stands at 46.27, while the Price to Book Value is significantly high at 23.60, and the EV to EBITDA ratio is 33.86. <BR><BR>In comparison to its peers, Waaree Renewables has a lower PEG ratio of 0.77 compared to ABB's 2.32 and BHEL's 0.61, yet it still reflects a very expensive valuation status. Notably, while Waaree has shown a strong ROCE of 128.35% and ROE of 51.00%, these figures do not justify the current high price levels. Additionally, the stock has underperformed against the Sensex over the past year, with a return of -54.62% compared to the Sensex's 7.59%.

View full answer

How big is Waaree Renewab.?

24-Jul-2025

As of 24th July, Waaree Renewable Technologies Ltd has a market capitalization of 11,554.00 Cr, with recent Net Sales of 1,964.59 Cr and a Net Profit of 287.30 Cr.

As of 24th July, Waaree Renewable Technologies Ltd has a market capitalization of 11,554.00 Cr, categorizing it as a Mid Cap company.<BR><BR>For the latest four quarters, the company reported Net Sales of 1,964.59 Cr and a Net Profit of 287.30 Cr.<BR><BR>The latest annual period for the balance sheet is March 2024, with Shareholder's Funds amounting to 232.26 Cr and Total Assets valued at 714.02 Cr.

View full answer

When is the next results date for Waaree Renewab.?

08-Oct-2025

Waaree Renewab. will declare its results on 10 October 2025.

Waaree Renewab. will declare its results on 10 October 2025.

View full answer

Are Waaree Renewab. latest results good or bad?

11-Oct-2025

Waaree Renewable Technologies reported strong Q2 FY26 results, with a net profit of ₹116 crores (up 34.53% QoQ and 117.20% YoY) and revenue growth of 28.45% sequentially. While the results are impressive, the stock's premium valuation and recent price corrections may raise investor concerns.

Waaree Renewable Technologies has reported impressive results for Q2 FY26, showcasing strong growth across key financial metrics. The company achieved a consolidated net profit of ₹116 crores, marking a significant 34.53% increase quarter-on-quarter and an outstanding 117.20% increase year-on-year. Revenue also saw a robust rise, climbing 28.45% sequentially to ₹775 crores, with a year-on-year growth of 47.73%.<BR><BR>The operating margin improved to 20.39%, reflecting better operational efficiency, and the return on equity (ROE) stands at a remarkable 51.00%, indicating strong capital efficiency. These results highlight Waaree's position as a high-growth player in the renewable energy sector, benefiting from India's increasing focus on renewable energy solutions.<BR><BR>However, it's worth noting that despite these strong fundamentals, the stock has faced some price corrections and is currently trading at a premium valuation, which may raise concerns among investors. Overall, the latest results can be considered very good, showcasing strong operational performance and growth potential, although the stock's valuation warrants careful consideration.

View full answer

How has been the historical performance of Waaree Renewab.?

03-Nov-2025

Waaree Renewab has shown significant growth from 2021 to 2025, with net sales increasing from INR 12.98 crore to INR 1,597.75 crore, and profit after tax improving from a loss of INR 2.37 crore to a profit of INR 228.92 crore. The company's total assets also rose substantially, indicating strong overall financial performance.

Answer:<BR>The historical performance of Waaree Renewab shows significant growth in net sales and profitability over the years, particularly from 2021 to 2025.<BR><BR>Breakdown:<BR>Waaree Renewab's net sales have increased dramatically from INR 12.98 crore in March 2021 to INR 1,597.75 crore in March 2025, reflecting a robust upward trend. The total operating income followed a similar trajectory, rising from INR 12.98 crore in March 2021 to INR 1,597.75 crore in March 2025. The company's total expenditure, excluding depreciation, also rose significantly, reaching INR 1,286.85 crore in March 2025, up from just INR 5.99 crore in March 2021. Operating profit (PBDIT) has shown a remarkable increase, climbing from INR 6.99 crore in March 2021 to INR 325.70 crore in March 2025, while profit before tax surged from INR 3.40 crore in March 2021 to INR 300.48 crore in March 2025. The profit after tax has also improved significantly, moving from a loss of INR 2.37 crore in March 2021 to a profit of INR 228.92 crore in March 2025. The company's total assets increased from INR 121.60 crore in March 2020 to INR 1,120.12 crore in March 2025, indicating strong growth in its asset base. Total liabilities also rose, but at a slower pace, from INR 121.60 crore in March 2020 to INR 1,120.12 crore in March 2025. Cash flow from operating activities improved significantly, reaching INR 302 crore in March 2025, compared to INR 2 crore in March 2021. Overall, Waaree Renewab has demonstrated a strong upward trend in both revenue and profitability over the past few years.

View full answer

Is Waaree Renewab. technically bullish or bearish?

03-Dec-2025

As of December 2, 2025, Waaree Renewab. shows a mildly bullish trend in the short term, but mixed signals from various indicators suggest significant bearish pressures in the longer time frames.

As of 2 December 2025, the technical trend for Waaree Renewab. has changed from sideways to mildly bullish. However, the overall technical stance remains mixed. The daily moving averages indicate a mildly bullish sentiment, while the weekly and monthly MACD readings are mildly bearish. The Bollinger Bands also reflect a bearish outlook on both weekly and monthly time frames. The KST shows a bullish signal on the weekly but is mildly bearish on the monthly, and the OBV is mildly bearish weekly but bullish monthly. The Dow Theory indicates no clear trend in both weekly and monthly perspectives. Given these conflicting indicators, the current stance is mildly bullish but with significant bearish pressures in the longer time frames.

View full answer

Should I buy, sell or hold Waaree Renewable Technologies Ltd?

15-Jan-2026

Why is Waaree Renewable Technologies Ltd falling/rising?

19-Jan-2026

As of 19-Jan, Waaree Renewable Technologies Ltd is experiencing a decline in its stock price, currently at 909.60, reflecting a total decline of -9.68% over the last three days and underperforming the market significantly. The stock shows negative returns across various time frames and is trading below its moving averages, indicating a bearish trend and a lack of investor confidence.

As of 19-Jan, Waaree Renewable Technologies Ltd is experiencing a decline in its stock price, currently at 909.60, which reflects a change of -31.5 (-3.35%). The stock has been underperforming significantly, with a consecutive fall over the last three days, resulting in a total decline of -9.68% during this period. Additionally, the stock has underperformed the sector by -2.44% today.<BR><BR>In terms of broader performance, the stock has shown negative returns over various time frames, including a -3.79% decline over the past week and a -4.05% decline over the past month. Year-to-date, the stock is down -5.94%, while it has notably underperformed the market over the last year with a return of -12.90%, contrasting sharply with the Sensex's gain of +8.65%.<BR><BR>The stock is currently trading below its moving averages across multiple time frames, indicating a bearish trend. Furthermore, despite a rise in investor participation, as evidenced by a 107.22% increase in delivery volume on January 16, the overall sentiment remains negative. The stock's valuation appears expensive with a Price to Book Value of 14.4, and domestic mutual funds hold only a minimal stake of 0.33%, suggesting a lack of confidence in the stock's current price.<BR><BR>Overall, the combination of recent price declines, underperformance relative to the market, and concerns regarding valuation and investor sentiment contribute to the falling stock price of Waaree Renewable Technologies Ltd.

View full answer
iScoreScore
Click here to find our call on this stock
Strong Sell
Sell
Hold
Buy
Strong Buy

MarketsMojo — Loved in India, Now Global

The power of Mojo is now in 29 countries. Explore global equities with the same cutting-edge features you love.

Dashboard

1

With ROE of 53.7, it has a Expensive valuation with a 14.4 Price to Book Value

  • The stock is trading at a discount compared to its peers' average historical valuations
  • Over the past year, while the stock has generated a return of 0.00%, its profits have risen by 124.9% ; the PEG ratio of the company is 0.2
2

Despite the size of the company, domestic mutual funds hold only 0.33% of the company

stock-summaryMojo Parameters

Mojo Parameters

Loading Valuation Snapshot...

Stock DNA

stock-summary
Industry

Power

stock-summary
Market cap

INR 9,221 Cr (Small Cap)

stock-summary
P/E

23.00

stock-summary
Industry P/E

55

stock-summary
Dividend Yield

0.11%

stock-summary
Debt Equity

-0.25

stock-summary
Return on Equity

53.67%

stock-summary
Price to Book

14.42

Revenue and Profits:
Net Sales:
851 Cr
(Quarterly Results - Dec 2025)
Net Profit:
120 Cr
stock-summaryTotal Returns
Total Returns (Price + Dividend) stock-summary
Dividend Yield (0.11%)
TimePeriod
Price Return
Dividend Return
Total Return
3 Months
-28.4%
0%
-28.4%
6 Months
-25.5%
0%
-25.5%
1 Year
0%
0%
0.0%
2 Years
0%
0%
0.0%
3 Years
0%
0%
0.0%
4 Years
0%
0%
0.0%
5 Years
0%
0%
0.0%

Latest dividend: 1 per share ex-dividend date: Jan-24-2025

Risk Adjusted Returns v/s stock-summary
Returns Beta
Icon
Beta has not been calculated since enough price history is not available
stock-summaryNews & Corporate Actions

News

Why is Waaree Renewable Technologies Ltd falling/rising?

Recent Price Movement and Market Performance

On 09-Jan, Waaree Renewable Technologies Ltd’s stock price dropped by ₹33.65, marking a 3.62% decrease. This decline is part of a broader short-term downtrend, with the stock losing 8.31% over the past week compared to the Sensex’s modest 2.55% fall. Year-to-date, the stock has declined by 7.47%, significantly underperforming the benchmark Sensex, which has only fallen 1.93% in the same period. Over the last year, the stock’s performance has been particularly weak, plunging 28.49%, while the Sensex has gained 7.67%. This stark contrast highlights investor caution surrounding the company despite its underlying fundamentals.

On the trading day, the stock underperformed its sector by 3.9%, hitting an intraday low of ₹890.20, do...

Read full news article
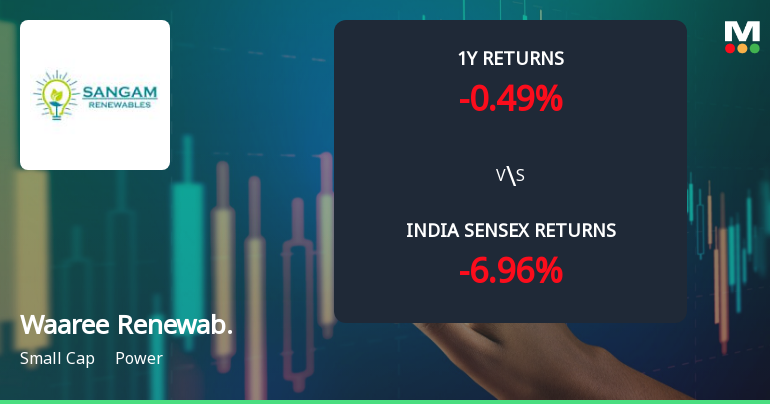
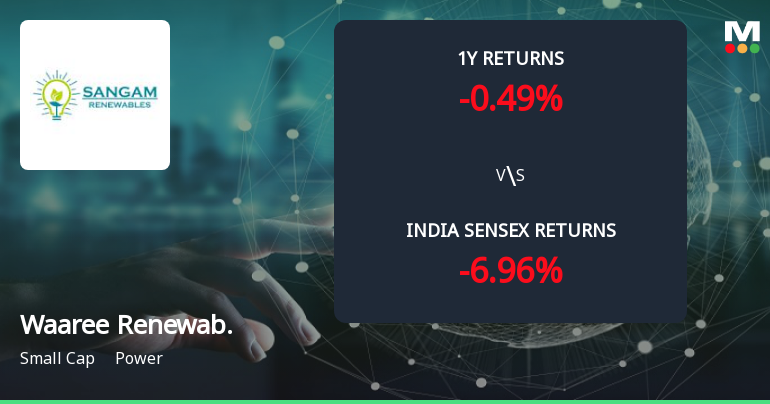
Announcements stock-summary

Icon
No announcement available

Corporate Actions stock-summary

stock-summary
BOARD MEETING

No Upcoming Board Meetings

stock-summary
DIVIDEND

Waaree Renewable Technologies Ltd has declared 50% dividend, ex-date: 24 Jan 25

stock-summary
SPLITS

Waaree Renewable Technologies Ltd has announced 2:10 stock split, ex-date: 15 Mar 24

stock-summary
BONUS

Waaree Renewable Technologies Ltd has announced 57:100 bonus issue, ex-date: 21 Jul 14

stock-summary
RIGHTS

No Rights history available

stock-summaryKey Factors

Quality key factors stock-summary

Factor
Value
Sales Growth (5y)
247.62%
EBIT Growth (5y)
223.84%
EBIT to Interest (avg)
20.07
Debt to EBITDA (avg)
1.93
Net Debt to Equity (avg)
-0.25
Sales to Capital Employed (avg)
2.60
Tax Ratio
24.61%
Dividend Payout Ratio
7.03%
Pledged Shares
0
Institutional Holding
1.49%
ROCE (avg)
87.05%
ROE (avg)
46.30%

Valuation key factors

Factor
Value
P/E Ratio
23
Industry P/E
55
Price to Book Value
14.42
EV to EBIT
16.88
EV to EBITDA
16.63
EV to Capital Employed
18.97
EV to Sales
3.45
PEG Ratio
0.18
Dividend Yield
0.11%
ROCE (Latest)
94.81%
ROE (Latest)
53.67%

Technicals key factors

Indicator
Weekly
Monthly
MACD
Bearish
Mildly Bearish
RSI
Bullish
No Signal
Bollinger Bands
Bearish
Bearish
Moving Averages
Bearish (Daily)
KST
Bearish
Mildly Bearish
Dow Theory
No Trend
Mildly Bearish
OBV
No Trend
Mildly Bearish
stock-summary Technical Indicator Scale: Bearish, Mildly Bearish, Sideways, Mildly Bullish, Bullish  Turned 
stock-summaryShareholding
Shareholding Snapshot : Dec 2025stock-summary
Shareholding Compare (%holding) stock-summary
Majority shareholders

Promoters

Pledged Promoter Holdings

None

Mutual Funds

Held by 7 Schemes (0.09%)

FIIs

Held by 70 FIIs (1.7%)

Promoter with highest holding

Waaree Energies Limited (74.32%)

Highest Public shareholder

Hitesh P Mehta (1.05%)

Individual Investors Holdings

19.58%

stock-summaryFinancial
[
  {
    "link": "quarterly",
    "btn_text": "All Quarterly Results",
    "header": "Quarterly Results Snapshot (Consolidated) - Dec'25 - YoY",
    "rhs": [
      {
        "prefix": "Net Sales ",
        "suffix": "YoY Growth in quarter ended Dec 2025 is 136.18% vs 11.15% in Dec 2024",
        "dir": 1
      },
      {
        "prefix": "Consolidated Net Profit ",
        "suffix": "YoY Growth in quarter ended Dec 2025 is 124.67% vs -16.72% in Dec 2024",
        "dir": 1
      }
    ],
    "table": {
      "header": [
        "Dec'25",
        "Dec'24",
        "Change(%)"
      ],
      "body": [
        {
          "field": "Net Sales",
          "val1": "851.06",
          "val2": "360.35",
          "chgp": "136.18%",
          "chgp_class": "positive"
        },
        {
          "field": "Operating Profit (PBDIT) excl Other Income",
          "val1": "158.80",
          "val2": "71.92",
          "chgp": "120.80%",
          "chgp_class": "positive"
        },
        {
          "field": "Interest",
          "val1": "3.42",
          "val2": "3.35",
          "chgp": "2.09%",
          "chgp_class": "negative"
        },
        {
          "field": "Exceptional Items",
          "val1": "0.00",
          "val2": "0.00",
          "chgp": "",
          "chgp_class": "neutral"
        },
        {
          "field": "Consolidate Net Profit",
          "val1": "120.22",
          "val2": "53.51",
          "chgp": "124.67%",
          "chgp_class": "positive"
        },
        {
          "field": "Operating Profit Margin (Excl OI)",
          "val1": "18.66%",
          "val2": "19.96%",
          "chgp": "-1.30%",
          "chgp_class": "negative"
        }
      ]
    }
  },
  {
    "link": "half-yearly",
    "btn_text": "All Half Yearly Results",
    "header": "Half Yearly Results Snapshot (Consolidated) - Sep'25",
    "rhs": [
      {
        "prefix": "Net Sales ",
        "suffix": " Growth in half year ended Sep 2025 is 81.12% vs 172.70% in Sep 2024",
        "dir": -1
      },
      {
        "prefix": "Consolidated Net Profit ",
        "suffix": " Growth in half year ended Sep 2025 is 147.73% vs 177.89% in Sep 2024",
        "dir": -1
      }
    ],
    "table": {
      "header": [
        "Sep'25",
        "Sep'24",
        "Change(%)"
      ],
      "body": [
        {
          "field": "Net Sales",
          "val1": "1,377.97",
          "val2": "760.82",
          "chgp": "81.12%",
          "chgp_class": "positive"
        },
        {
          "field": "Operating Profit (PBDIT) excl Other Income",
          "val1": "275.49",
          "val2": "112.64",
          "chgp": "144.58%",
          "chgp_class": "positive"
        },
        {
          "field": "Interest",
          "val1": "7.18",
          "val2": "7.11",
          "chgp": "0.98%",
          "chgp_class": "negative"
        },
        {
          "field": "Exceptional Items",
          "val1": "0.00",
          "val2": "0.00",
          "chgp": "",
          "chgp_class": "neutral"
        },
        {
          "field": "Consolidate Net Profit",
          "val1": "202.74",
          "val2": "81.84",
          "chgp": "147.73%",
          "chgp_class": "positive"
        },
        {
          "field": "Operating Profit Margin (Excl OI)",
          "val1": "19.99%",
          "val2": "14.81%",
          "chgp": "5.18%",
          "chgp_class": "positive"
        }
      ]
    }
  },
  {
    "link": "nine-monthly",
    "btn_text": "All Nine Monthly Results",
    "header": "Nine Monthly Results Snapshot (Consolidated) - Dec'25",
    "rhs": [
      {
        "prefix": "Net Sales ",
        "suffix": "YoY Growth in nine months ended Dec 2025 is 98.81% vs 85.87% in Dec 2024",
        "dir": 1
      },
      {
        "prefix": "Consolidated Net Profit ",
        "suffix": "YoY Growth in nine months ended Dec 2025 is 138.61% vs 44.45% in Dec 2024",
        "dir": 1
      }
    ],
    "table": {
      "header": [
        "Dec'25",
        "Dec'24",
        "Change(%)"
      ],
      "body": [
        {
          "field": "Net Sales",
          "val1": "2,229.03",
          "val2": "1,121.17",
          "chgp": "98.81%",
          "chgp_class": "positive"
        },
        {
          "field": "Operating Profit (PBDIT) excl Other Income",
          "val1": "434.29",
          "val2": "184.56",
          "chgp": "135.31%",
          "chgp_class": "positive"
        },
        {
          "field": "Interest",
          "val1": "10.60",
          "val2": "10.46",
          "chgp": "1.34%",
          "chgp_class": "negative"
        },
        {
          "field": "Exceptional Items",
          "val1": "0.00",
          "val2": "0.00",
          "chgp": "",
          "chgp_class": "neutral"
        },
        {
          "field": "Consolidate Net Profit",
          "val1": "322.96",
          "val2": "135.35",
          "chgp": "138.61%",
          "chgp_class": "positive"
        },
        {
          "field": "Operating Profit Margin (Excl OI)",
          "val1": "19.48%",
          "val2": "16.46%",
          "chgp": "3.02%",
          "chgp_class": "positive"
        }
      ]
    }
  },
  {
    "link": "annual",
    "btn_text": "All Annual Results",
    "header": "Annual Results Snapshot (Consolidated) - Mar'25",
    "rhs": [
      {
        "prefix": "Net Sales ",
        "suffix": "YoY Growth in year ended Mar 2025 is 82.30% vs 149.73% in Mar 2024",
        "dir": -1
      },
      {
        "prefix": "Consolidated Net Profit ",
        "suffix": "YoY Growth in year ended Mar 2025 is 54.70% vs 167.29% in Mar 2024",
        "dir": -1
      }
    ],
    "table": {
      "header": [
        "Mar'25",
        "Mar'24",
        "Change(%)"
      ],
      "body": [
        {
          "field": "Net Sales",
          "val1": "1,597.75",
          "val2": "876.44",
          "chgp": "82.30%",
          "chgp_class": "positive"
        },
        {
          "field": "Operating Profit (PBDIT) excl Other Income",
          "val1": "310.90",
          "val2": "207.19",
          "chgp": "50.06%",
          "chgp_class": "positive"
        },
        {
          "field": "Interest",
          "val1": "14.84",
          "val2": "6.77",
          "chgp": "119.20%",
          "chgp_class": "negative"
        },
        {
          "field": "Exceptional Items",
          "val1": "-4.02",
          "val2": "0.00",
          "chgp": "",
          "chgp_class": "neutral"
        },
        {
          "field": "Consolidate Net Profit",
          "val1": "229.16",
          "val2": "148.13",
          "chgp": "54.70%",
          "chgp_class": "positive"
        },
        {
          "field": "Operating Profit Margin (Excl OI)",
          "val1": "19.46%",
          "val2": "23.64%",
          "chgp": "-4.18%",
          "chgp_class": "negative"
        }
      ]
    }
  }
]

Quarterly Results Snapshot (Consolidated) - Dec'25 - YoYstock-summary

Dec'25
Dec'24
Change(%)
Net Sales
851.06
360.35
136.18%
Operating Profit (PBDIT) excl Other Income
158.80
71.92
120.80%
Interest
3.42
3.35
2.09%
Exceptional Items
0.00
0.00
Consolidate Net Profit
120.22
53.51
124.67%
Operating Profit Margin (Excl OI)
18.66%
19.96%
-1.30%
Values in Rs Cr.
Direction Arrows
Net Sales

YoY Growth in quarter ended Dec 2025 is 136.18% vs 11.15% in Dec 2024

Direction Arrows
Consolidated Net Profit

YoY Growth in quarter ended Dec 2025 is 124.67% vs -16.72% in Dec 2024

Half Yearly Results Snapshot (Consolidated) - Sep'25stock-summary

Sep'25
Sep'24
Change(%)
Net Sales
1,377.97
760.82
81.12%
Operating Profit (PBDIT) excl Other Income
275.49
112.64
144.58%
Interest
7.18
7.11
0.98%
Exceptional Items
0.00
0.00
Consolidate Net Profit
202.74
81.84
147.73%
Operating Profit Margin (Excl OI)
19.99%
14.81%
5.18%
Values in Rs Cr.
Direction Arrows
Net Sales

Growth in half year ended Sep 2025 is 81.12% vs 172.70% in Sep 2024

Direction Arrows
Consolidated Net Profit

Growth in half year ended Sep 2025 is 147.73% vs 177.89% in Sep 2024

Nine Monthly Results Snapshot (Consolidated) - Dec'25stock-summary

Dec'25
Dec'24
Change(%)
Net Sales
2,229.03
1,121.17
98.81%
Operating Profit (PBDIT) excl Other Income
434.29
184.56
135.31%
Interest
10.60
10.46
1.34%
Exceptional Items
0.00
0.00
Consolidate Net Profit
322.96
135.35
138.61%
Operating Profit Margin (Excl OI)
19.48%
16.46%
3.02%
Values in Rs Cr.
Direction Arrows
Net Sales

YoY Growth in nine months ended Dec 2025 is 98.81% vs 85.87% in Dec 2024

Direction Arrows
Consolidated Net Profit

YoY Growth in nine months ended Dec 2025 is 138.61% vs 44.45% in Dec 2024

Annual Results Snapshot (Consolidated) - Mar'25stock-summary

Mar'25
Mar'24
Change(%)
Net Sales
1,597.75
876.44
82.30%
Operating Profit (PBDIT) excl Other Income
310.90
207.19
50.06%
Interest
14.84
6.77
119.20%
Exceptional Items
-4.02
0.00
Consolidate Net Profit
229.16
148.13
54.70%
Operating Profit Margin (Excl OI)
19.46%
23.64%
-4.18%
Values in Rs Cr.
Direction Arrows
Net Sales

YoY Growth in year ended Mar 2025 is 82.30% vs 149.73% in Mar 2024

Direction Arrows
Consolidated Net Profit

YoY Growth in year ended Mar 2025 is 54.70% vs 167.29% in Mar 2024

stock-summaryCompany CV
About Waaree Renewable Technologies Ltd stock-summary
stock-summary
Waaree Renewable Technologies Ltd
Small Cap
Power
Sangam Renewables Limited was originally incorporated on 22 June 1999. The Company got converted into a Public Company on November 18, 2011 and thereafter the name was changed from `Sangam Renewables Limited' to `Waaree Renewable Technologies Limited' vide fresh Certificate of Incorporation issued by the Registrar of Companies on July 19, 2021.
Company Coordinates stock-summary
Company Details
504-B Western Edge-1, Off W/E Highway Borivali (E) Mumbai Maharashtra : 400066
stock-summary
Tel: 91-22-43331500
stock-summary
stock-summary
info@sangamrenew.com
Registrar Details
Purva Shareregistry (India) Pvt Ltd , Gala No 9, Shiv Shakti, Industrial Estate,Sitaram Mill Comp., J R Boricha Marg, Lower Parel [E], Mumbai