
Compare Wakefit Innovati with Similar Stocks
Dashboard
Poor Management Efficiency with a low ROE of 0%
- The company has reported losses. Due to this company has reported negative ROE
The company is Net-Debt Free
Healthy long term growth as Operating profit has grown by an annual rate 0%
With ROE of 37.1, it has a Very Attractive valuation with a 7.9 Price to Book Value
High Institutional Holdings at 42%
Stock DNA
Furniture, Home Furnishing
INR 4,205 Cr (Small Cap)
28.00
NA
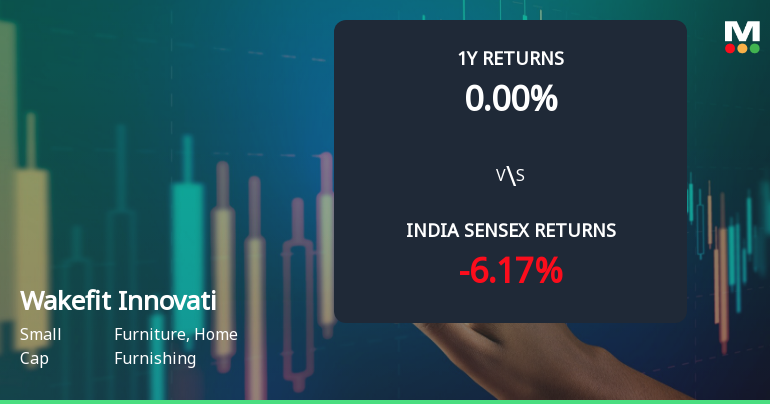
0.00%
-0.12
37.06%
7.94
Total Returns (Price + Dividend) 
Wakefit Innovati for the last several years.
Risk Adjusted Returns v/s
Returns Beta

News
Wakefit Innovations Ltd Technical Momentum Shifts Amid Market Pressure
Wakefit Innovations Ltd, a small-cap player in the Furniture and Home Furnishing sector, has experienced a notable shift in its technical momentum, signalling a transition from a sideways trend to a mildly bearish phase. Despite a recent upgrade in its Mojo Grade from Sell to Hold, the stock’s price action and technical indicators suggest caution for investors navigating the current market environment.
Read full news article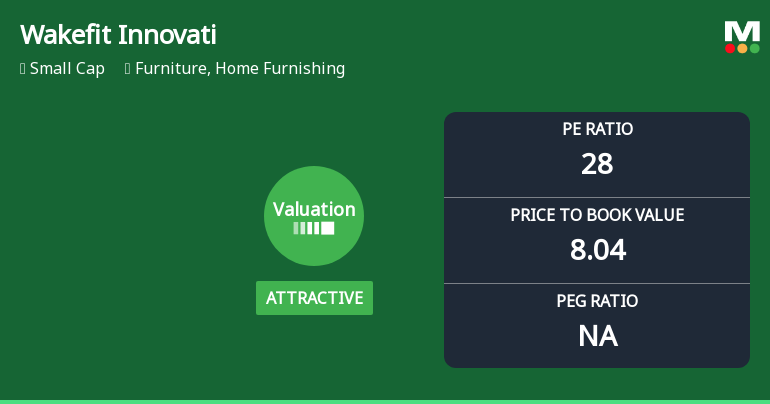
Wakefit Innovations Ltd Valuation Shifts Signal Renewed Price Attractiveness
Wakefit Innovations Ltd has witnessed a notable shift in its valuation parameters, moving from a very attractive to an attractive grade, reflecting a changing investor sentiment amid broader market dynamics. This article analyses the recent changes in key valuation metrics such as the price-to-earnings (P/E) and price-to-book value (P/BV) ratios, comparing them with historical averages and peer benchmarks to assess the stock’s price attractiveness.
Read full news article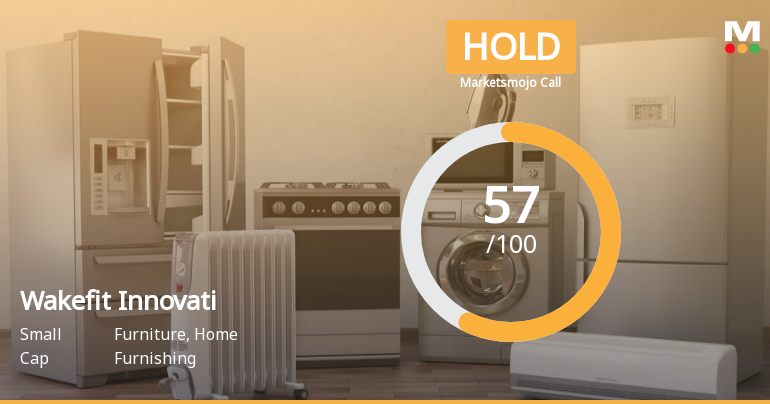
Wakefit Innovations Ltd is Rated Hold by MarketsMOJO
Wakefit Innovations Ltd is rated 'Hold' by MarketsMOJO, with this rating last updated on 29 June 2026. However, the analysis and financial metrics discussed here reflect the stock's current position as of 05 July 2026, providing investors with the latest insights into the company’s performance and outlook.
Read full news article Announcements
Corporate Actions

No Upcoming Board Meetings

No Dividend history available

No Splits history available

No Bonus history available

No Rights history available
Quality key factors
Valuation key factors
Technicals key factors
 Technical Indicator Scale: Bearish, Mildly Bearish, Sideways, Mildly Bullish, Bullish Turned
 Shareholding Snapshot : Mar 2026
Shareholding Compare (%holding)
Promoters
None
Held by 13 Schemes (13.37%)
Held by 14 FIIs (15.38%)
Ankit Garg (28.93%)
Peak Xv Partners Investments Vi (13.79%)
3.45%
Quarterly Results Snapshot (Standalone) - Mar'26 - QoQ

QoQ Growth in quarter ended Mar 2026 is -18.45% vs 11.80% in Dec 2025

QoQ Growth in quarter ended Mar 2026 is 282.14% vs 99.62% in Dec 2025
Half Yearly Results Snapshot (Standalone) - Sep'25
Not Applicable: The company has declared_date for only one period
Not Applicable: The company has declared_date for only one period
Nine Monthly Results Snapshot (Standalone) - Dec'25
Not Applicable: The company has declared_date for only one period
Not Applicable: The company has declared_date for only one period
Annual Results Snapshot (Standalone) - Mar'26
YoY Growth in year ended Mar 2026 is 16.90% vs 29.13% in Mar 2025
YoY Growth in year ended Mar 2026 is 640.51% vs -132.56% in Mar 2025
About Wakefit Innovations Ltd

Company Coordinates


