
Compare Wanbury with Similar Stocks
Stock DNA
Pharmaceuticals & Biotechnology
INR 975 Cr (Micro Cap)
22.00
35
0.00%
2.77
72.53%
16.51
Total Returns (Price + Dividend) 
Latest dividend: 1 per share ex-dividend date: Jul-29-2010
Risk Adjusted Returns v/s
Returns Beta

News

Wanbury Ltd Upgraded to Buy on Strong Technical and Financial Performance
Wanbury Ltd, a micro-cap player in the Pharmaceuticals & Biotechnology sector, has seen its investment rating upgraded from Hold to Buy, reflecting significant improvements across technical indicators, financial trends, valuation metrics, and overall quality. This upgrade, effective from 24 June 2026, comes amid robust quarterly results, attractive valuation multiples, and a bullish technical outlook, signalling renewed investor confidence in the stock’s medium to long-term prospects.
Read full news article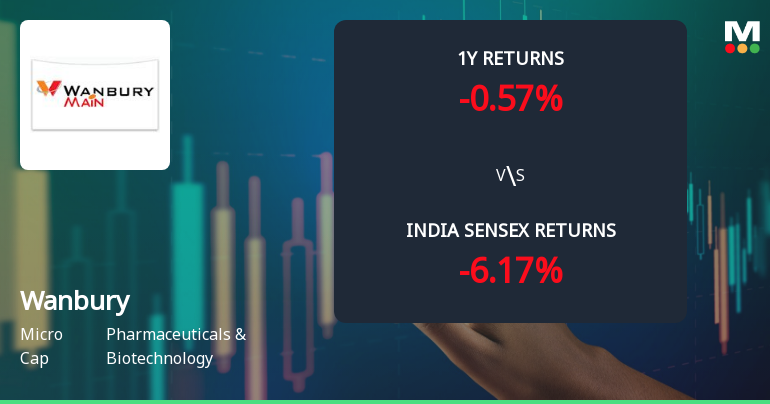
Wanbury Ltd Technical Momentum Shifts Signal Bullish Outlook Amid Mixed Monthly Indicators
Wanbury Ltd, a micro-cap player in the Pharmaceuticals & Biotechnology sector, has witnessed a notable shift in its technical momentum, upgrading its MarketsMOJO grade from Hold to Buy as of 24 June 2026. Despite a modest day decline of 1.44%, the stock’s technical indicators reveal a predominantly bullish trend on weekly and daily charts, signalling potential upside amid mixed monthly signals.
Read full news article
Wanbury Ltd is Rated Hold by MarketsMOJO
Wanbury Ltd is rated 'Hold' by MarketsMOJO, with this rating last updated on 01 June 2026. However, the analysis and financial metrics presented here reflect the stock's current position as of 20 June 2026, providing investors with an up-to-date view of the company's fundamentals, returns, and market standing.
Read full news article Announcements
Announcement under Regulation 30 (LODR)-Press Release / Media Release
10-Jun-2026 | Source : BSEPress Release on Quality inspection by the Therapeutic Goods Administration (TGA) at Tanuku Andhra Pradesh
Announcement under Regulation 30 (LODR)-Press Release / Media Release
09-Jun-2026 | Source : BSEPress Release on Launch of New APIs.
Announcement under Regulation 30 (LODR)-Press Release / Media Release
02-Jun-2026 | Source : BSEPress Release on Q4 & Year ended FY 2026 for Audited Financial Results
Corporate Actions

No Upcoming Board Meetings

Wanbury Ltd has declared 10% dividend, ex-date: 29 Jul 10

No Splits history available

No Bonus history available

No Rights history available
Quality key factors
Valuation key factors
Technicals key factors
 Technical Indicator Scale: Bearish, Mildly Bearish, Sideways, Mildly Bullish, Bullish Turned
 Shareholding Snapshot : Mar 2026
Shareholding Compare (%holding)
Non Institution
86.6929
Held by 4 Schemes (0.0%)
Held by 4 FIIs (0.59%)
Expert Chemicals (india) Pvt Ltd (34.36%)
Suresh Bhatia (3.11%)
42.17%
Quarterly Results Snapshot (Standalone) - Mar'26 - QoQ

QoQ Growth in quarter ended Mar 2026 is 1.31% vs 1.49% in Dec 2025

QoQ Growth in quarter ended Mar 2026 is 37.69% vs 3.82% in Dec 2025
Half Yearly Results Snapshot (Standalone) - Sep'25
Growth in half year ended Sep 2025 is 10.59% vs 0.53% in Sep 2024
Growth in half year ended Sep 2025 is 216.45% vs -24.81% in Sep 2024
Nine Monthly Results Snapshot (Standalone) - Dec'25
YoY Growth in nine months ended Dec 2025 is 14.08% vs -2.41% in Dec 2024
YoY Growth in nine months ended Dec 2025 is 332.20% vs -53.94% in Dec 2024
Annual Results Snapshot (Standalone) - Mar'26
YoY Growth in year ended Mar 2026 is 8.47% vs 4.14% in Mar 2025
YoY Growth in year ended Mar 2026 is 116.61% vs 0.43% in Mar 2025
About Wanbury Ltd

Company Coordinates


