
Compare Weizmann with Similar Stocks
Stock DNA
Garments & Apparels
INR 123 Cr (Micro Cap)
22.00
15
0.70%
0.06
8.97%
1.88
Total Returns (Price + Dividend) 
Latest dividend: 0.5 per share ex-dividend date: Sep-18-2025
Risk Adjusted Returns v/s
Returns Beta

News
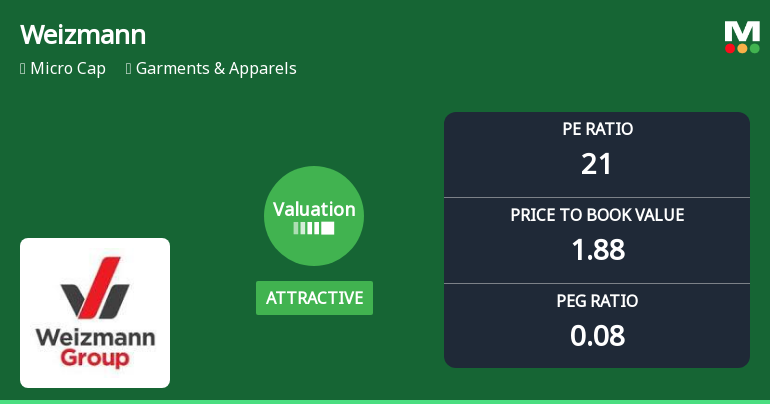
Weizmann Ltd Valuation Shifts Signal Renewed Price Attractiveness Amid Sector Challenges
Weizmann Ltd, a micro-cap player in the Garments & Apparels sector, has seen its valuation parameters shift favourably, moving from a fair to an attractive rating. Despite a challenging return profile relative to the Sensex and peers, the company’s price-to-earnings (P/E) and price-to-book value (P/BV) ratios now present a compelling case for investors seeking value in this segment.
Read full news article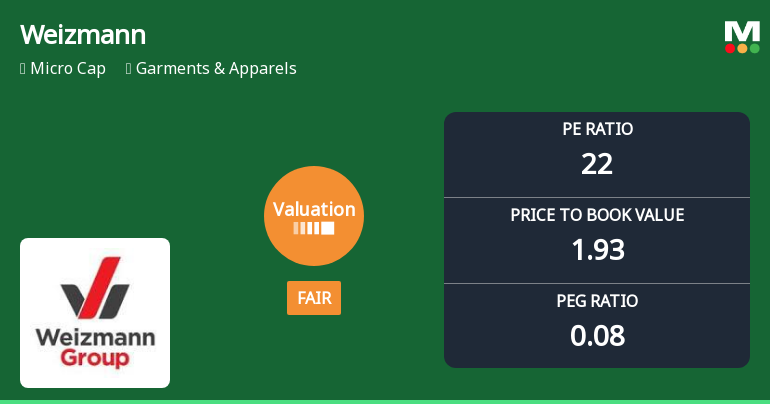
Weizmann Ltd Valuation Shifts Signal Changing Market Sentiment
Weizmann Ltd, a micro-cap player in the Garments & Apparels sector, has seen its valuation parameters shift notably over recent months, moving from an attractive to a fair valuation grade. This change reflects evolving market perceptions amid sector headwinds and company-specific performance metrics, with key ratios such as the price-to-earnings (P/E) and price-to-book value (P/BV) signalling a recalibration of price attractiveness relative to historical and peer benchmarks.
Read full news article
Weizmann Ltd Valuation Shifts Signal Renewed Price Attractiveness Amid Sector Challenges
Weizmann Ltd, a micro-cap player in the Garments & Apparels sector, has seen a notable shift in its valuation parameters, moving from fair to attractive territory. Despite recent price declines and underperformance relative to the Sensex, the company’s improved price-to-earnings and price-to-book ratios suggest a potential value opportunity for discerning investors.
Read full news article Announcements
Disclosures under Reg. 29(1) of SEBI (SAST) Regulations 2011
11-Jun-2026 | Source : BSEThe Exchange has received the disclosure under Regulation 29(1) of SEBI (Substantial Acquisition of Shares & Takeovers) Regulations 2011 for Mira Ankit Khambhati
Disclosures under Reg. 29(2) of SEBI (SAST) Regulations 2011
11-Jun-2026 | Source : BSEThe Exchange has received the disclosure under Regulation 29(2) of SEBI (Substantial Acquisition of Shares & Takeovers) Regulations 2011 for Mira Ankit Khambhati
Disclosures under Reg. 29(2) of SEBI (SAST) Regulations 2011
11-Jun-2026 | Source : BSEThe Exchange has received the disclosure under Regulation 29(2) of SEBI (Substantial Acquisition of Shares & Takeovers) Regulations 2011 for Kanan Siraj
Corporate Actions

No Upcoming Board Meetings

Weizmann Ltd has declared 5% dividend, ex-date: 18 Sep 25

No Splits history available

No Bonus history available

No Rights history available
Quality key factors
Valuation key factors
Technicals key factors
 Technical Indicator Scale: Bearish, Mildly Bearish, Sideways, Mildly Bullish, Bullish Turned
 Shareholding Snapshot : Mar 2026
Shareholding Compare (%holding)
Promoters
None
Held by 0 Schemes
Held by 0 FIIs
Hansneel Impex Private Limited (19.97%)
Kanan Neelkamal Siraj (6.36%)
15.06%
Quarterly Results Snapshot (Consolidated) - Mar'26 - QoQ

QoQ Growth in quarter ended Mar 2026 is 13.70% vs -20.68% in Dec 2025

QoQ Growth in quarter ended Mar 2026 is -84.81% vs 19.10% in Dec 2025
Half Yearly Results Snapshot (Consolidated) - Sep'25
Growth in half year ended Sep 2025 is 25.66% vs -17.89% in Sep 2024
Growth in half year ended Sep 2025 is 2.90% vs -34.04% in Sep 2024
Nine Monthly Results Snapshot (Consolidated) - Dec'25
YoY Growth in nine months ended Dec 2025 is 16.46% vs -12.20% in Dec 2024
YoY Growth in nine months ended Dec 2025 is 9.23% vs -28.81% in Dec 2024
Annual Results Snapshot (Consolidated) - Mar'26
YoY Growth in year ended Mar 2026 is 8.05% vs -4.60% in Mar 2025
YoY Growth in year ended Mar 2026 is 264.17% vs -140.18% in Mar 2025
About Weizmann Ltd

Company Coordinates


