
Compare West Coast Paper with Similar Stocks
Dashboard
High Management Efficiency with a high ROE of 17.91%
Company has a Debt to Equity ratio (avg) of 0.01 times
Healthy long term growth as Operating profit has grown by an annual rate 47.77%
Flat results in Mar 26
With ROE of 4.2, it has a Expensive valuation with a 0.9 Price to Book Value
Majority shareholders : Promoters
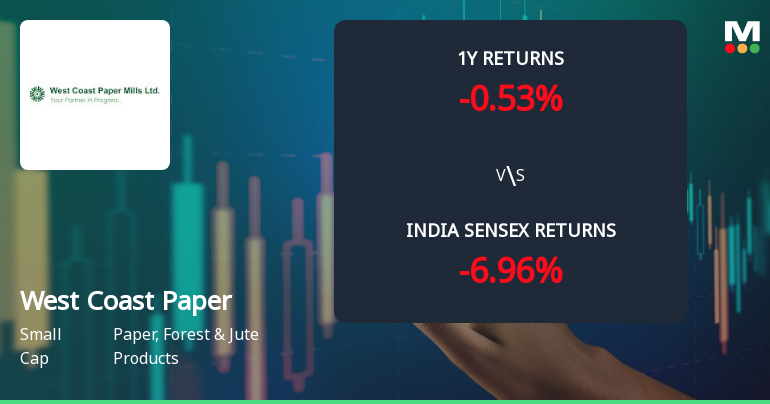
Consistent Underperformance against the benchmark over the last 3 years
With its market cap of Rs 3,273 cr, it is the second biggest company in the sector (behind JK Paper)and constitutes 13.85% of the entire sector
Stock DNA
Paper, Forest & Jute Products
INR 3,296 Cr (Small Cap)
22.00
17
1.01%
-0.24
4.17%
0.91
Total Returns (Price + Dividend) 
Latest dividend: 4.98051282051282 per share ex-dividend date: Aug-14-2025
Risk Adjusted Returns v/s
Returns Beta

News
West Coast Paper Mills Ltd Technical Momentum Shifts Amid Mixed Market Signals
West Coast Paper Mills Ltd has experienced a notable shift in its technical momentum, transitioning from a bullish to a mildly bullish trend as of late June 2026. Despite a recent day decline of 2.33%, the stock’s underlying technical indicators present a nuanced picture, reflecting both resilience and caution in the paper, forest and jute products sector.
Read full news article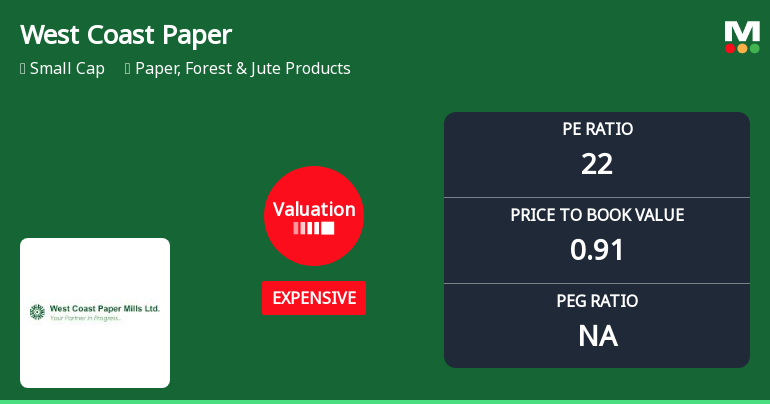
West Coast Paper Mills Ltd Valuation Shifts Signal Changing Price Attractiveness
West Coast Paper Mills Ltd has recently undergone a notable shift in its valuation parameters, moving from a 'very expensive' to an 'expensive' rating. This change, accompanied by a downgrade in its Mojo Grade from Buy to Hold, reflects evolving market perceptions amid fluctuating price-to-earnings and price-to-book ratios. Investors are now reassessing the stock’s price attractiveness in the context of its historical performance and peer comparisons within the Paper, Forest & Jute Products sector.
Read full news article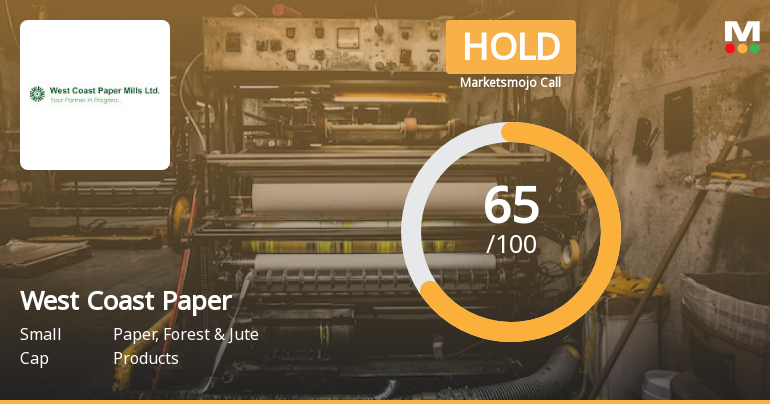
West Coast Paper Mills Ltd is Rated Hold
West Coast Paper Mills Ltd is rated 'Hold' by MarketsMOJO, with this rating last updated on 29 May 2026. However, the analysis below reflects the stock’s current position as of 22 June 2026, incorporating the latest fundamentals, returns, and financial metrics available today.
Read full news article Announcements
Announcement under Regulation 30 (LODR)-Newspaper Publication
20-Jun-2026 | Source : BSESpecial Window for Re-lodgement of Transfer Requests of Physical Shares
Corporate Action: Record/Cut Off Date And Book Closure For AGM And Dividend
17-Jun-2026 | Source : BSEIntimation of Record/Cut Off date and Book closure for AGM and Dividend
Annual General Meeting And Dividend Update
17-Jun-2026 | Source : BSE71st Annual General Meeting and Dividend update
Corporate Actions

No Upcoming Board Meetings

West Coast Paper Mills Ltd has declared 250% dividend, ex-date: 14 Aug 25

West Coast Paper Mills Ltd has announced 2:10 stock split, ex-date: 26 Oct 07

No Bonus history available

No Rights history available
Quality key factors
Valuation key factors
Technicals key factors
 Technical Indicator Scale: Bearish, Mildly Bearish, Sideways, Mildly Bullish, Bullish Turned
 Shareholding Snapshot : Mar 2026
Shareholding Compare (%holding)
Promoters
None
Held by 7 Schemes (11.61%)
Held by 58 FIIs (3.24%)
Veer Enterprises Limited (16.27%)
Nippon Life India Trustee Ltd-a/c Nippon India Small Cap Fund (5.09%)
20.79%
Quarterly Results Snapshot (Consolidated) - Mar'26 - QoQ

QoQ Growth in quarter ended Mar 2026 is 20.22% vs -0.69% in Dec 2025
QoQ Growth in quarter ended Mar 2026 is 93.04% vs 53.57% in Dec 2025
Half Yearly Results Snapshot (Consolidated) - Sep'25
Growth in half year ended Sep 2025 is -0.37% vs -14.03% in Sep 2024

Growth in half year ended Sep 2025 is -64.58% vs -53.48% in Sep 2024
Nine Monthly Results Snapshot (Consolidated) - Dec'25
YoY Growth in nine months ended Dec 2025 is 0.41% vs -10.56% in Dec 2024
YoY Growth in nine months ended Dec 2025 is -63.04% vs -53.31% in Dec 2024
Annual Results Snapshot (Consolidated) - Mar'26
YoY Growth in year ended Mar 2026 is 5.33% vs -8.66% in Mar 2025
YoY Growth in year ended Mar 2026 is -51.60% vs -55.04% in Mar 2025
About West Coast Paper Mills Ltd

Company Coordinates


