Western Carriers

  • Market Cap: Micro Cap
  • Industry: Transport Services
  • ISIN: INE0CJF01024
  • NSEID: WCIL
  • BSEID: 544258
INR
115.30
4.95 (4.49%)
BSENSE

Jan 19

BSE+NSE Vol: 3.32 lacs

  • Price Points
  • Score
  • Mojo Parameters
  • Total Return
  • News and Corporate Actions
  • Key factors
  • Shareholding
  • Financials
  • CompanyCV
stock-summaryPrice Point
High/Low

1Day

52 Week

Valuation
Technical
Day's Volume

CASH

3.32 lacs (109.50%) Volume

Shareholding (Dec 2025)

FII

0.25%

Held by 6 FIIs

DII

0.00%

Held by 2 DIIs

Promoter

72.86%

Who are the top shareholders of the Western Carriers?

06-Jun-2025

The top shareholder of Western Carriers is Rajendra Sethia, holding 71.88%. Other notable shareholders include individual investors with 17.88%, Aditya Birla Sun Life Insurance with 3.99%, and mutual funds with a combined 3.4%.

The top shareholders of Western Carriers include Rajendra Sethia, who is the promoter with the highest holding at 71.88%. The company also has a significant individual investor base, holding 17.88% of shares. Among institutional investors, Aditya Birla Sun Life Insurance Company Limited stands out as the highest public shareholder with a 3.99% stake. Additionally, mutual funds hold a combined 3.4% through three schemes, while foreign institutional investors (FIIs) have a minor stake of 0.29% across four entities. There are no pledged promoter holdings reported.

View full answer

Has Western Carriers declared dividend?

06-Jun-2025

No Dividend History Available

Who are the peers of the Western Carriers?

16-Jul-2025

Western Carriers' peers include Kernex Microsys, Afcom Holdings, Ecos (India), and others, with varying management and growth risks. Kernex Microsys has the highest 1-year return at 126.34%, while Rel. Indl. Infra has the lowest at -29.78%.

Peers: The peers of Western Carriers are Kernex Microsys., Afcom Holdings, Ecos (India), Navkar Corporat., Rel. Indl. Infra, Allcargo Gati, Snowman Logistic, Ritco Logistics, and TransIndia Real.<BR><BR>Quality Snapshot: Excellent management risk is observed at Ecos (India), while Average management risk is found at Afcom Holdings, Snowman Logistic, Ritco Logistics, TransIndia Real, and the rest. Below Average management risk is noted for Kernex Microsys., Navkar Corporat., Rel. Indl. Infra, and Allcargo Gati. In terms of Growth, Excellent growth is seen at Kernex Microsys., Afcom Holdings, Ecos (India), and Ritco Logistics, while Below Average growth is noted for Navkar Corporat., Rel. Indl. Infra, Allcargo Gati, and the rest. For Capital Structure, Excellent capital structure is found at Afcom Holdings and Ecos (India), while Average capital structure is noted for Western Carriers, and Below Average capital structure is observed at Kernex Microsys., Navkar Corporat., Rel. Indl. Infra, Allcargo Gati, and the rest.<BR><BR>Return Snapshot: The peer with the highest 1-year return is Kernex Microsys. at 126.34%, while the peer with the lowest is Rel. Indl. Infra at -29.78%. Western Carriers does not have a 1-year return available for comparison. Additionally, the peers with negative six-month returns include Afcom Holdings, Navkar Corporat., Rel. Indl. Infra, Allcargo Gati, Snowman Logistic, Ritco Logistics, and TransIndia Real.

View full answer

What does Western Carriers do?

17-Jul-2025

Western Carriers (India) Ltd is a small-cap transport services company based in Kolkata, incorporated in 2011. As of March 2025, it reported net sales of ₹4,286 Cr and a net profit of ₹141 Cr, with a market cap of ₹1,180 Cr.

Overview:<BR>Western Carriers (India) Ltd operates in the transport services industry and is categorized as a small-cap company.<BR><BR>History:<BR>The company was incorporated as Western Carriers (India) Private Limited in 2011 in Kolkata, West Bengal. It later converted to a public limited company and changed its name to Western Carriers (India) Limited in 2013. The most recent quarterly results reported net sales and net profit for the period ending March 2025.<BR><BR>Financial Snapshot:<BR>- Net Sales: 4,286 Cr (Quarterly Results - Mar 2025)<BR>- Net Profit: 141 Cr (Quarterly Results - Mar 2025)<BR>- Market Cap: INR 1,180 Cr (Small Cap)<BR><BR>Key Metrics:<BR>- P/E: 18.00<BR>- Industry P/E: 37<BR>- Dividend Yield: 0.00%<BR>- Debt-Equity: 0.60<BR>- Return on Equity: 16.35%<BR>- Price to Book: 2.97<BR><BR>Contact Details:<BR>No Company Details Available. Registrar Address: Not available.

View full answer

How big is Western Carriers?

24-Jul-2025

As of 24th July, Western Carriers (India) Ltd has a market capitalization of 1,173.00 Cr, with recent net sales of 1,725.72 Cr and a net profit of 65.14 Cr. The company's shareholder's funds are 398.36 Cr, and total assets amount to 750.36 Cr.

As of 24th July, Western Carriers (India) Ltd has a market capitalization of 1,173.00 Cr, categorizing it as a Small Cap company.<BR><BR>In the latest four quarters, the company reported Net Sales of 1,725.72 Cr and a Net Profit of 65.14 Cr.<BR><BR>The latest annual period for the balance sheet is March 2024, showing Shareholder's Funds of 398.36 Cr and Total Assets of 750.36 Cr.

View full answer

Are Western Carriers latest results good or bad?

15-Aug-2025

Western Carriers' latest results are concerning, with a 43.6% drop in Profit Before Tax and a decline in net sales to Rs 415.82 crore, the lowest in five quarters. The company has received a 'Hold' rating, indicating significant financial challenges that may warrant caution for investors.

Western Carriers' latest financial results for the quarter ending June 2025 indicate a challenging period for the company. The Profit Before Tax (PBT) decreased significantly by 43.6%, dropping to Rs 10.52 crore, while the Profit After Tax (PAT) fell by 33.7% to Rs 10.79 crore. This decline in profitability is concerning, especially when compared to the average figures from the previous quarters.<BR><BR>Additionally, the company's net sales declined to Rs 415.82 crore, marking the lowest level in the last five quarters, which reflects a decrease in operational performance. The operating profit margin also fell to 5.00%, suggesting reduced efficiency in operations. Furthermore, the Earnings per Share (EPS) decreased to Rs 1.06, indicating lower returns for shareholders.<BR><BR>Given these results, the overall assessment is that Western Carriers is facing significant financial challenges, which is reflected in the 'Hold' rating assigned by MarketsMOJO. This suggests that the current performance is not favorable and may require careful consideration by investors.

View full answer

When is the next results date for Western Carriers?

11-Nov-2025

The next results date for Western Carriers is 14 November 2025.

The next results date for Western Carriers is scheduled for 14 November 2025.

View full answer

How has been the historical performance of Western Carriers?

17-Nov-2025

Western Carriers experienced mixed financial performance from March 2024 to March 2025, with net sales rising to 1,725.72 Cr but a decline in profitability metrics, including profit after tax falling to 65.13 Cr and earnings per share decreasing to 6.39. Total assets increased significantly, but operational challenges led to negative cash flow from operating activities.

Answer:<BR>The historical performance of Western Carriers shows a mixed trend in financial metrics from March 2024 to March 2025.<BR><BR>Breakdown:<BR>In the fiscal year ending March 2025, Western Carriers reported net sales of 1,725.72 Cr, a slight increase from 1,685.77 Cr in the previous year. Total operating income also rose to 1,725.72 Cr from 1,685.77 Cr, while total expenditure increased from 1,539.71 Cr to 1,605.79 Cr. Operating profit (PBDIT) decreased to 133.14 Cr from 151.70 Cr, leading to a decline in profit before tax from 108.41 Cr to 87.84 Cr. Consequently, profit after tax fell to 65.13 Cr from 80.35 Cr, resulting in a decrease in earnings per share from 10.21 to 6.39. On the balance sheet, total assets grew significantly to 1,099.46 Cr from 750.36 Cr, with total liabilities also increasing from 750.36 Cr to 1,099.46 Cr. Cash flow from operating activities turned negative at -2.00 Cr, while cash flow from financing activities improved to 246.00 Cr, leading to a net cash inflow of 2.00 Cr by the end of March 2025. Overall, while sales and total assets have increased, profitability metrics indicate a decline, reflecting challenges in operational efficiency and cost management.

View full answer

Is Western Carriers overvalued or undervalued?

19-Nov-2025

As of November 18, 2025, Western Carriers is considered very expensive and overvalued, with a PE ratio of 26.17, an EV to EBIT of 19.93, and an EV to EBITDA of 14.26, showing mixed positioning compared to peers and a concerning PEG ratio of 0.00, alongside recent underperformance against the Sensex.

As of 18 November 2025, the valuation grade for Western Carriers has moved from expensive to very expensive, indicating a significant increase in perceived valuation. The company is currently deemed overvalued. Key ratios include a PE ratio of 26.17, an EV to EBIT of 19.93, and an EV to EBITDA of 14.26, all of which suggest that the company's valuation is high compared to its earnings and cash flow generation capabilities.<BR><BR>In comparison to peers, Western Carriers' PE ratio is lower than Container Corporation's 30.39 but higher than Transport Corporation's 20.06, highlighting a mixed positioning within the industry. Additionally, the PEG ratio stands at 0.00, indicating no expected growth, which is concerning when compared to peers like Aegis Logistics, which has a PEG of 1.70. The stock has underperformed relative to the Sensex over the past week and month, with returns of -4.32% and -3.59%, respectively, further reinforcing the notion of overvaluation in light of its recent performance.

View full answer

Is Western Carriers technically bullish or bearish?

02-Dec-2025

As of December 1, 2025, Western Carriers shows a mildly bullish trend based on daily moving averages and weekly Dow Theory, though caution is advised due to bearish signals from the MACD and KST, along with a lack of strong momentum indicated by the RSI and Bollinger Bands.

As of 1 December 2025, the technical trend for Western Carriers has changed from mildly bearish to mildly bullish. The daily moving averages indicate a mildly bullish stance, while the weekly MACD and KST are still mildly bearish, suggesting some caution. The Dow Theory on a weekly basis supports a mildly bullish outlook, but the absence of signals in the RSI and the sideways Bollinger Bands indicate a lack of strong momentum. Overall, the current technical stance is mildly bullish, driven primarily by the daily moving averages and the weekly Dow Theory, despite some bearish indicators in the MACD and KST.

View full answer

Should I buy, sell or hold Western Carriers (India) Ltd?

15-Jan-2026

Why is Western Carriers (India) Ltd falling/rising?

19-Jan-2026

As of 18-Jan, Western Carriers (India) Ltd's stock price is declining at Rs 110.35, down 3.16%, with a consistent decrease over the past week and month. Factors contributing to this trend include weak financial performance, reduced investor participation, and a bearish market outlook.

As of 18-Jan, Western Carriers (India) Ltd is experiencing a decline in its stock price, currently at Rs 110.35, which reflects a change of -3.6 (-3.16%). The stock has underperformed its sector by 2.7% today and has touched an intraday low of Rs 110.3. This downward trend is supported by several factors.<BR><BR>Over the past week, the stock has decreased by 4.87%, and in the last month, it has fallen by 8.35%, indicating a consistent decline. The company's performance has also been weak year-to-date, with a drop of 8.23%. In contrast, the broader market, represented by the Sensex, has only seen a minor decline of 1.94% during the same period. <BR><BR>The stock is trading below its 5-day, 20-day, 50-day, 100-day, and 200-day moving averages, which suggests a bearish trend. Additionally, there has been a significant decrease in investor participation, with delivery volume falling by 27.92% compared to the 5-day average. This lack of interest from investors is further compounded by the company's weak long-term fundamentals, including a -4.94% CAGR growth in operating profits over the last five years and a low return on equity of 5.55%.<BR><BR>Moreover, the company has reported negative results for the last four consecutive quarters, with a notable 37.2% decline in profit after tax compared to the previous four-quarter average. The valuation appears expensive with a price-to-book value of 1.3, especially given the decline in profits by 19% over the past year. Institutional investors have also reduced their stake by 1.4% in the last quarter, indicating a lack of confidence in the company's future performance.<BR><BR>Overall, the combination of poor financial results, declining investor participation, and unfavorable market conditions has contributed to the falling stock price of Western Carriers (India) Ltd.

View full answer
iScoreScore
Click here to find our call on this stock
Strong Sell
Sell
Hold
Buy
Strong Buy

MarketsMojo — Loved in India, Now Global

The power of Mojo is now in 29 countries. Explore global equities with the same cutting-edge features you love.

Dashboard

1

Weak Long Term Fundamental Strength with a -4.94% CAGR growth in Operating Profits over the last 5 years

  • The company has been able to generate a Return on Equity (avg) of 5.55% signifying low profitability per unit of shareholders funds
2

The company has declared Negative results for the last 4 consecutive quarters

3

With ROE of 5.5, it has a Very Expensive valuation with a 1.4 Price to Book Value

4

Falling Participation by Institutional Investors

stock-summaryMojo Parameters

Mojo Parameters

Loading Valuation Snapshot...

Stock DNA

stock-summary
Industry

Transport Services

stock-summary
Market cap

INR 1,105 Cr (Micro Cap)

stock-summary
P/E

25.00

stock-summary
Industry P/E

32

stock-summary
Dividend Yield

0.00%

stock-summary
Debt Equity

0.03

stock-summary
Return on Equity

5.55%

stock-summary
Price to Book

1.33

Revenue and Profits:
Net Sales:
440 Cr
(Quarterly Results - Sep 2025)
Net Profit:
9 Cr
stock-summaryTotal Returns
Total Returns (Price + Dividend) stock-summary
Dividend Yield (0%)
TimePeriod
Price Return
Dividend Return
Total Return
3 Months
-8.19%
0%
-8.19%
6 Months
2.28%
0%
2.28%
1 Year
5.13%
0%
5.13%
2 Years
0%
0%
0.0%
3 Years
0%
0%
0.0%
4 Years
0%
0%
0.0%
5 Years
0%
0%
0.0%

Western Carriers for the last several years.

Risk Adjusted Returns v/s stock-summary
Returns Beta
Icon
Beta has not been calculated since enough price history is not available
stock-summaryNews & Corporate Actions

News

Why is Western Carriers (India) Ltd falling/rising?

Stock Performance Against Benchmarks

Over the past week, Western Carriers has underperformed significantly, with its stock price declining by 4.87%, while the Sensex remained virtually flat, registering a negligible 0.01% change. This trend extends over longer periods as well; the stock has fallen 8.35% in the last month compared to a 1.31% decline in the Sensex. Year-to-date, the stock is down 8.23%, markedly worse than the Sensex’s 1.94% drop. Even over the last year, Western Carriers has barely managed a 0.64% gain, lagging far behind the Sensex’s robust 8.47% return. These figures highlight the stock’s persistent underperformance relative to the broader market.

Intraday Trading and Technical Indicators

On 16-Jan, the stock touched an intrada...

Read full news article
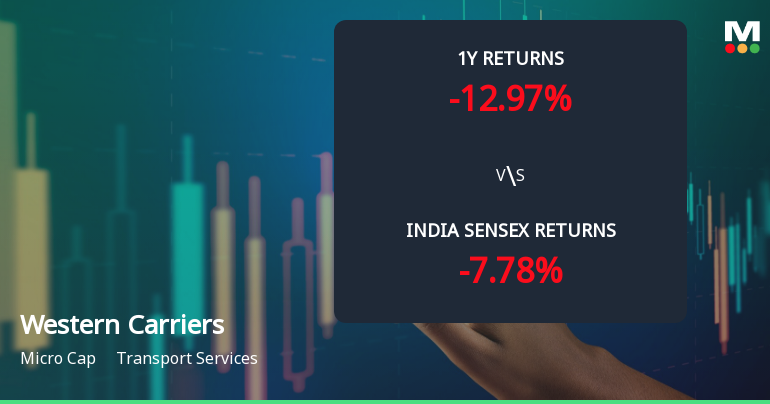
Announcements stock-summary

Icon
No announcement available

Corporate Actions stock-summary

stock-summary
BOARD MEETING

No Upcoming Board Meetings

stock-summary
DIVIDEND

No Dividend history available

stock-summary
SPLITS

No Splits history available

stock-summary
BONUS

No Bonus history available

stock-summary
RIGHTS

No Rights history available

stock-summaryKey Factors

Quality key factors stock-summary

Factor
Value
Sales Growth (5y)
2.80%
EBIT Growth (5y)
-4.94%
EBIT to Interest (avg)
4.30
Debt to EBITDA (avg)
1.73
Net Debt to Equity (avg)
0.03
Sales to Capital Employed (avg)
1.85
Tax Ratio
26.14%
Dividend Payout Ratio
0
Pledged Shares
0
Institutional Holding
5.00%
ROCE (avg)
13.51%
ROE (avg)
5.55%

Valuation key factors

Factor
Value
P/E Ratio
25
Industry P/E
32
Price to Book Value
1.38
EV to EBIT
19.00
EV to EBITDA
13.59
EV to Capital Employed
1.37
EV to Sales
0.69
PEG Ratio
NA
Dividend Yield
NA
ROCE (Latest)
7.23%
ROE (Latest)
5.55%

Technicals key factors

Indicator
Weekly
Monthly
MACD
Mildly Bearish
RSI
No Signal
No Signal
Bollinger Bands
Sideways
Moving Averages
Mildly Bullish (Daily)
KST
Mildly Bearish
Dow Theory
Mildly Bearish
No Trend
OBV
No Trend
No Trend
stock-summary Technical Indicator Scale: Bearish, Mildly Bearish, Sideways, Mildly Bullish, Bullish  Turned 
stock-summaryShareholding
Shareholding Snapshot : Dec 2025stock-summary
Shareholding Compare (%holding) stock-summary
Majority shareholders

Promoters

Pledged Promoter Holdings

None

Mutual Funds

Held by 1 Schemes (0.98%)

FIIs

Held by 6 FIIs (0.25%)

Promoter with highest holding

Rajendra Sethia (72.65%)

Highest Public shareholder

Aditya Birla Sun Life Insurance Company Limited (3.77%)

Individual Investors Holdings

18.28%

stock-summaryFinancial
[
  {
    "link": "quarterly",
    "btn_text": "All Quarterly Results",
    "header": "Quarterly Results Snapshot (Consolidated) - Sep'25 - QoQ",
    "rhs": [
      {
        "prefix": "Net Sales ",
        "suffix": "QoQ Growth in quarter ended Sep 2025 is 5.72% vs -2.98% in Jun 2025",
        "dir": 1
      },
      {
        "prefix": "Consolidated Net Profit ",
        "suffix": "QoQ Growth in quarter ended Sep 2025 is -17.05% vs -23.37% in Jun 2025",
        "dir": 1
      }
    ],
    "table": {
      "header": [
        "Sep'25",
        "Jun'25",
        "Change(%)"
      ],
      "body": [
        {
          "field": "Net Sales",
          "val1": "439.62",
          "val2": "415.82",
          "chgp": "5.72%",
          "chgp_class": "positive"
        },
        {
          "field": "Operating Profit (PBDIT) excl Other Income",
          "val1": "18.83",
          "val2": "20.79",
          "chgp": "-9.43%",
          "chgp_class": "negative"
        },
        {
          "field": "Interest",
          "val1": "4.53",
          "val2": "4.53",
          "chgp": "",
          "chgp_class": "neutral"
        },
        {
          "field": "Exceptional Items",
          "val1": "0.00",
          "val2": "0.00",
          "chgp": "",
          "chgp_class": "neutral"
        },
        {
          "field": "Consolidate Net Profit",
          "val1": "8.95",
          "val2": "10.79",
          "chgp": "-17.05%",
          "chgp_class": "negative"
        },
        {
          "field": "Operating Profit Margin (Excl OI)",
          "val1": "4.28%",
          "val2": "5.00%",
          "chgp": "-0.72%",
          "chgp_class": "negative"
        }
      ]
    }
  },
  {
    "link": "half-yearly",
    "btn_text": "All Half Yearly Results",
    "header": "Half Yearly Results Snapshot (Consolidated) - Sep'25",
    "rhs": [
      {
        "prefix": "Net Sales ",
        "suffix": " Growth in half year ended Sep 2025 is 0.15% vs 3.23% in Sep 2024",
        "dir": -1
      },
      {
        "prefix": "Consolidated Net Profit ",
        "suffix": " Growth in half year ended Sep 2025 is -47.89% vs 5.87% in Sep 2024",
        "dir": -1
      }
    ],
    "table": {
      "header": [
        "Sep'25",
        "Sep'24",
        "Change(%)"
      ],
      "body": [
        {
          "field": "Net Sales",
          "val1": "855.43",
          "val2": "854.14",
          "chgp": "0.15%",
          "chgp_class": "positive"
        },
        {
          "field": "Operating Profit (PBDIT) excl Other Income",
          "val1": "39.61",
          "val2": "71.60",
          "chgp": "-44.68%",
          "chgp_class": "negative"
        },
        {
          "field": "Interest",
          "val1": "9.06",
          "val2": "12.80",
          "chgp": "-29.22%",
          "chgp_class": "positive"
        },
        {
          "field": "Exceptional Items",
          "val1": "0.00",
          "val2": "0.00",
          "chgp": "",
          "chgp_class": "neutral"
        },
        {
          "field": "Consolidate Net Profit",
          "val1": "19.73",
          "val2": "37.86",
          "chgp": "-47.89%",
          "chgp_class": "negative"
        },
        {
          "field": "Operating Profit Margin (Excl OI)",
          "val1": "4.63%",
          "val2": "8.38%",
          "chgp": "-3.75%",
          "chgp_class": "negative"
        }
      ]
    }
  },
  {
    "link": "nine-monthly",
    "btn_text": "All Nine Monthly Results",
    "header": "Nine Monthly Results Snapshot (Standalone) - Dec'24",
    "rhs": [
      {
        "prefix": "Net Sales ",
        "suffix": "Not Applicable: The company has declared_date for only one period",
        "dir": 0
      },
      {
        "prefix": "Standalone Net Profit ",
        "suffix": "Not Applicable: The company has declared_date for only one period",
        "dir": 0
      }
    ],
    "table": {
      "header": [
        "Dec'24",
        "Dec'23",
        "Change(%)"
      ],
      "body": [
        {
          "field": "Net Sales",
          "val1": "1,297.14",
          "val2": "1,284.13",
          "chgp": "1.01%",
          "chgp_class": "positive"
        },
        {
          "field": "Operating Profit (PBDIT) excl Other Income",
          "val1": "95.00",
          "val2": "102.22",
          "chgp": "-7.06%",
          "chgp_class": "negative"
        },
        {
          "field": "Interest",
          "val1": "17.31",
          "val2": "15.43",
          "chgp": "12.18%",
          "chgp_class": "negative"
        },
        {
          "field": "Exceptional Items",
          "val1": "0.00",
          "val2": "0.00",
          "chgp": "",
          "chgp_class": "neutral"
        },
        {
          "field": "Standalone Net Profit",
          "val1": "51.05",
          "val2": "56.13",
          "chgp": "-9.05%",
          "chgp_class": "negative"
        },
        {
          "field": "Operating Profit Margin (Excl OI)",
          "val1": "7.32%",
          "val2": "7.96%",
          "chgp": "-0.64%",
          "chgp_class": "negative"
        }
      ]
    }
  },
  {
    "link": "annual",
    "btn_text": "All Annual Results",
    "header": "Annual Results Snapshot (Standalone) - Mar'25",
    "rhs": [
      {
        "prefix": "Net Sales ",
        "suffix": "YoY Growth in year ended Mar 2025 is 2.37% vs 3.23% in Mar 2024",
        "dir": -1
      },
      {
        "prefix": "Standalone Net Profit ",
        "suffix": "YoY Growth in year ended Mar 2025 is -18.92% vs 12.27% in Mar 2024",
        "dir": -1
      }
    ],
    "table": {
      "header": [
        "Mar'25",
        "Mar'24",
        "Change(%)"
      ],
      "body": [
        {
          "field": "Net Sales",
          "val1": "1,725.72",
          "val2": "1,685.77",
          "chgp": "2.37%",
          "chgp_class": "positive"
        },
        {
          "field": "Operating Profit (PBDIT) excl Other Income",
          "val1": "119.93",
          "val2": "146.06",
          "chgp": "-17.89%",
          "chgp_class": "negative"
        },
        {
          "field": "Interest",
          "val1": "21.51",
          "val2": "22.18",
          "chgp": "-3.02%",
          "chgp_class": "positive"
        },
        {
          "field": "Exceptional Items",
          "val1": "0.00",
          "val2": "0.00",
          "chgp": "",
          "chgp_class": "neutral"
        },
        {
          "field": "Standalone Net Profit",
          "val1": "65.13",
          "val2": "80.33",
          "chgp": "-18.92%",
          "chgp_class": "negative"
        },
        {
          "field": "Operating Profit Margin (Excl OI)",
          "val1": "6.95%",
          "val2": "8.66%",
          "chgp": "-1.71%",
          "chgp_class": "negative"
        }
      ]
    }
  }
]

Quarterly Results Snapshot (Consolidated) - Sep'25 - QoQstock-summary

Sep'25
Jun'25
Change(%)
Net Sales
439.62
415.82
5.72%
Operating Profit (PBDIT) excl Other Income
18.83
20.79
-9.43%
Interest
4.53
4.53
Exceptional Items
0.00
0.00
Consolidate Net Profit
8.95
10.79
-17.05%
Operating Profit Margin (Excl OI)
4.28%
5.00%
-0.72%
Values in Rs Cr.
Direction Arrows
Net Sales

QoQ Growth in quarter ended Sep 2025 is 5.72% vs -2.98% in Jun 2025

Direction Arrows
Consolidated Net Profit

QoQ Growth in quarter ended Sep 2025 is -17.05% vs -23.37% in Jun 2025

Half Yearly Results Snapshot (Consolidated) - Sep'25stock-summary

Sep'25
Sep'24
Change(%)
Net Sales
855.43
854.14
0.15%
Operating Profit (PBDIT) excl Other Income
39.61
71.60
-44.68%
Interest
9.06
12.80
-29.22%
Exceptional Items
0.00
0.00
Consolidate Net Profit
19.73
37.86
-47.89%
Operating Profit Margin (Excl OI)
4.63%
8.38%
-3.75%
Values in Rs Cr.
Direction Arrows
Net Sales

Growth in half year ended Sep 2025 is 0.15% vs 3.23% in Sep 2024

Direction Arrows
Consolidated Net Profit

Growth in half year ended Sep 2025 is -47.89% vs 5.87% in Sep 2024

Nine Monthly Results Snapshot (Standalone) - Dec'24stock-summary

Dec'24
Dec'23
Change(%)
Net Sales
1,297.14
1,284.13
1.01%
Operating Profit (PBDIT) excl Other Income
95.00
102.22
-7.06%
Interest
17.31
15.43
12.18%
Exceptional Items
0.00
0.00
Standalone Net Profit
51.05
56.13
-9.05%
Operating Profit Margin (Excl OI)
7.32%
7.96%
-0.64%
Values in Rs Cr.
Net Sales

Not Applicable: The company has declared_date for only one period

Standalone Net Profit

Not Applicable: The company has declared_date for only one period

Annual Results Snapshot (Standalone) - Mar'25stock-summary

Mar'25
Mar'24
Change(%)
Net Sales
1,725.72
1,685.77
2.37%
Operating Profit (PBDIT) excl Other Income
119.93
146.06
-17.89%
Interest
21.51
22.18
-3.02%
Exceptional Items
0.00
0.00
Standalone Net Profit
65.13
80.33
-18.92%
Operating Profit Margin (Excl OI)
6.95%
8.66%
-1.71%
Values in Rs Cr.
Direction Arrows
Net Sales

YoY Growth in year ended Mar 2025 is 2.37% vs 3.23% in Mar 2024

Direction Arrows
Standalone Net Profit

YoY Growth in year ended Mar 2025 is -18.92% vs 12.27% in Mar 2024

stock-summaryCompany CV
About Western Carriers (India) Ltd stock-summary
stock-summary
Western Carriers (India) Ltd
Micro Cap
Transport Services
Western Carriers (India) Limited was incorporated as `Western Carriers (India) Private Limited' in Kolkata, West Bengal dated March 23, 2011. Subsequently, Company converted into a Public Limited and the name of the Company was changed to `Western Carriers (India) Limited', through a fresh Certificate of Incorporation dated February 28, 2013 issued by the RoC, to Company.
Company Coordinates stock-summary
Icon
No Company Details Available