
Compare White Organic with Similar Stocks
Dashboard
With a Operating Losses, the company has a Weak Long Term Fundamental Strength
- Company's ability to service its debt is weak with a poor EBIT to Interest (avg) ratio of 0.11
- The company has been able to generate a Return on Equity (avg) of 5.95% signifying low profitability per unit of shareholders funds
Flat results in Mar 26
Risky - Negative EBITDA
Consistent Underperformance against the benchmark over the last 3 years
Stock DNA
Other Agricultural Products
INR 14 Cr (Micro Cap)
13.00
23
0.00%
-0.01
1.79%
0.24
Total Returns (Price + Dividend) 
White Organic for the last several years.
Risk Adjusted Returns v/s
Returns Beta

News
When is the next results date for White Organic Agro Ltd?
The next results date for White Organic Agro Ltd is scheduled for 29 May 2026....
Read full news article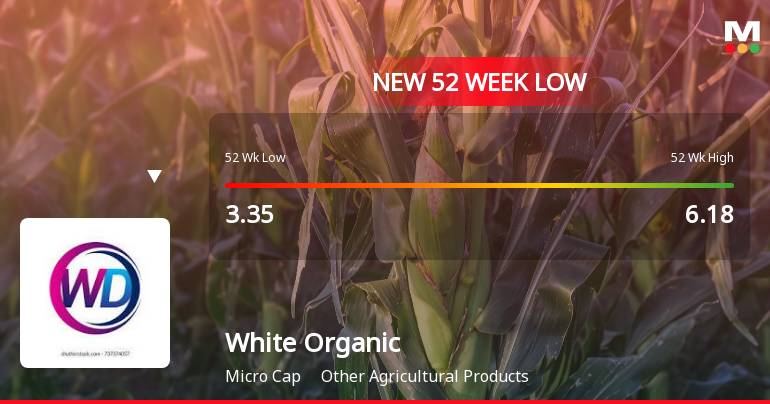
Five Consecutive Losses Push White Organic Agro Ltd to a New 52-Week Low
For the fifth straight session, White Organic Agro Ltd closed lower, breaching its 52-week low at Rs 3.07 on 30 Mar 2026, marking a 13.46% decline over this losing streak and underperforming its sector by 2.45% today.
Read full news article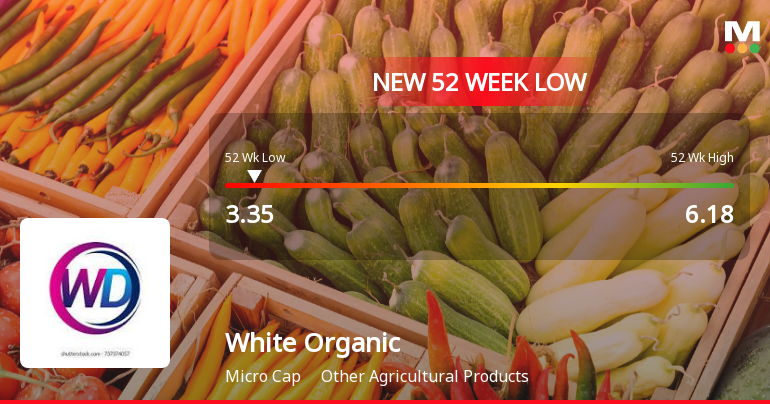
Announcements
Announcement under Regulation 30 (LODR)-Newspaper Publication
30-May-2026 | Source : BSEStakeholders are requested to take on record newspaper publication made with respect to the audited financial results of the company for the quarter and financial year ended 31st March 2026.
Submission Audited Financial Results Of The Company For The Quarter And Financial Year Ended 31St March 2026.
29-May-2026 | Source : BSEAudited Financial Result for Financial Year Ended 31st March 2026
Compliances-Reg.24(A)-Annual Secretarial Compliance
29-May-2026 | Source : BSEAnnual Secretarial Compliance Report for FY 2025-26 issued by Practising Company Secretary / Secretarial Auditor
Corporate Actions

No Upcoming Board Meetings

No Dividend history available

No Splits history available

White Organic Agro Ltd has announced 1:1 bonus issue, ex-date: 06 Feb 19

No Rights history available
Quality key factors
Valuation key factors
Technicals key factors
 Technical Indicator Scale: Bearish, Mildly Bearish, Sideways, Mildly Bullish, Bullish Turned
 Shareholding Snapshot : Mar 2026
Shareholding Compare (%holding)
Non Institution
None
Held by 0 Schemes
Held by 0 FIIs
Sapna Infratech Private Limited (9.93%)
Jr Seamless Private Limited (2.7%)
66.58%
Quarterly Results Snapshot (Standalone) - Mar'26 - YoY

YoY Growth in quarter ended Mar 2026 is 213.33% vs -47.96% in Mar 2025

YoY Growth in quarter ended Mar 2026 is -210.53% vs 131.93% in Mar 2025
Half Yearly Results Snapshot (Standalone) - Sep'25
Growth in half year ended Sep 2025 is -99.35% vs -22.62% in Sep 2024
Growth in half year ended Sep 2025 is 7.33% vs -25.37% in Sep 2024
Nine Monthly Results Snapshot (Standalone) - Dec'25
YoY Growth in nine months ended Dec 2025 is -99.42% vs -39.16% in Dec 2024
YoY Growth in nine months ended Dec 2025 is 9.70% vs -43.46% in Dec 2024
Annual Results Snapshot (Standalone) - Mar'26
YoY Growth in year ended Mar 2026 is -32.45% vs -41.32% in Mar 2025
YoY Growth in year ended Mar 2026 is -43.35% vs 47.86% in Mar 2025
About White Organic Agro Ltd

Company Coordinates


