
Compare Worth Peripheral with Similar Stocks
Total Returns (Price + Dividend) 
Latest dividend: 1 per share ex-dividend date: Sep-16-2025
Risk Adjusted Returns v/s
Returns Beta

News
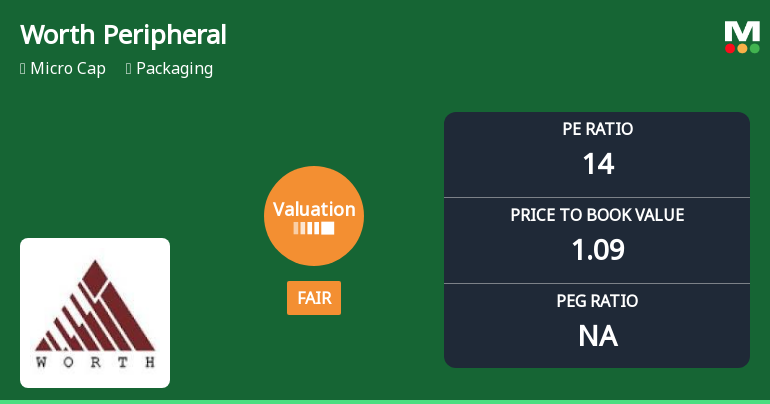
Worth Peripherals Ltd Valuation Shifts to Fair Amid Mixed Market Performance
Worth Peripherals Ltd, a micro-cap player in the packaging sector, has recently seen its valuation parameters shift from expensive to fair, signalling a notable change in price attractiveness. This article analyses the company’s updated price-to-earnings (P/E) and price-to-book value (P/BV) ratios in comparison with historical trends and peer averages, providing investors with a comprehensive view of its current market standing.
Read full news article
Worth Peripherals Ltd is Rated Sell
Worth Peripherals Ltd is rated 'Sell' by MarketsMOJO, with this rating last updated on 29 May 2026. However, the analysis and financial metrics discussed here reflect the stock's current position as of 31 May 2026, providing investors with the most up-to-date view of the company’s fundamentals, returns, and technical outlook.
Read full news article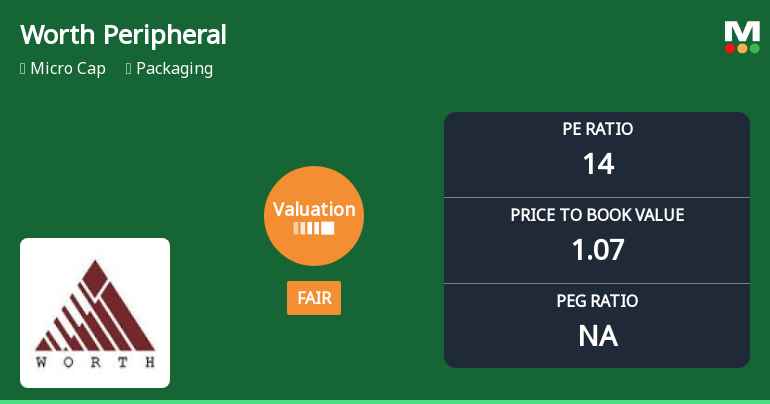
Worth Peripherals Ltd Valuation Shifts to Fair; Price Attractiveness Improves Amid Market Pressure
Worth Peripherals Ltd has witnessed a notable shift in its valuation parameters, moving from an expensive to a fair valuation grade. This change, coupled with a recent upgrade in its Mojo Grade from Sell to Hold, reflects a recalibration of investor sentiment amid a challenging market backdrop. Despite a 5.31% decline in the stock price on 26 May 2026, the company’s price-to-earnings (P/E) and price-to-book value (P/BV) ratios now suggest a more attractive entry point relative to its historical and peer averages.
Read full news article Announcements
Worth Peripherals Limited - Date of payment of dividend
15-Nov-2019 | Source : NSEWorth Peripherals Limited has informed the Exchange regarding Date of payment of dividend
Worth Peripherals Limited - Financial Results Updates
14-Nov-2019 | Source : NSEWorth Peripherals Limited has informed the Exchange regarding the financial results for the period ended September 30, 2019.
Worth Peripherals Limited - Trading Window
06-Nov-2019 | Source : NSEWorth Peripherals Limited has informed the Exchange regarding the Trading Window closure pursuant to SEBI (Prohibition of Insider Trading) Regulations, 2015
Corporate Actions

No Upcoming Board Meetings

Worth Peripherals Ltd has declared 10% dividend, ex-date: 16 Sep 25

No Splits history available

No Bonus history available

No Rights history available
Quality key factors
Valuation key factors
Technicals key factors
 Technical Indicator Scale: Bearish, Mildly Bearish, Sideways, Mildly Bullish, Bullish Turned
 Shareholding Snapshot : Mar 2026
Shareholding Compare (%holding)
Promoters
None
Held by 0 Schemes
Held by 0 FIIs
Raminder Singh Chadha (31.25%)
Vijit Global Securities Private Limited (5.04%)
21.91%
Quarterly Results Snapshot (Consolidated) - Mar'26 - YoY

YoY Growth in quarter ended Mar 2026 is 6.98% vs 19.98% in Mar 2025
YoY Growth in quarter ended Mar 2026 is -30.86% vs -24.16% in Mar 2025
Half Yearly Results Snapshot (Consolidated) - Sep'25
Growth in half year ended Sep 2025 is 12.53% vs 14.15% in Sep 2024

Growth in half year ended Sep 2025 is 26.18% vs 1.12% in Sep 2024
Nine Monthly Results Snapshot (Consolidated) - Dec'25
YoY Growth in nine months ended Dec 2025 is 11.80% vs 14.23% in Dec 2024
YoY Growth in nine months ended Dec 2025 is 7.09% vs 12.26% in Dec 2024
Annual Results Snapshot (Consolidated) - Mar'26
YoY Growth in year ended Mar 2026 is 10.56% vs 15.65% in Mar 2025
YoY Growth in year ended Mar 2026 is -5.18% vs -2.83% in Mar 2025
About Worth Peripherals Ltd

Company Coordinates


