
Compare Xchanging Sol. with Similar Stocks
Stock DNA
Computers - Software & Consulting
INR 707 Cr (Micro Cap)
12.00
22
3.21%
-0.61
15.01%
1.76
Total Returns (Price + Dividend) 
Latest dividend: 2 per share ex-dividend date: Jul-11-2025
Risk Adjusted Returns v/s
Returns Beta

News

Xchanging Solutions Ltd is Rated Sell by MarketsMOJO
Xchanging Solutions Ltd is rated 'Sell' by MarketsMOJO, with this rating last updated on 06 Nov 2025. However, the analysis and financial metrics discussed here reflect the stock's current position as of 07 July 2026, providing investors with an up-to-date view of the company's fundamentals, returns, and market standing.
Read full news article
Xchanging Solutions Ltd Technical Momentum Shifts Amid Bearish Market Trends
Xchanging Solutions Ltd has exhibited a nuanced shift in its technical momentum, moving from a predominantly bearish stance to a mildly bearish outlook, as reflected in recent market data and technical indicators. Despite a 3.92% rise in the stock price to ₹63.02 on 3 Jul 2026, the company’s micro-cap status and mixed technical signals suggest cautious investor sentiment amid broader sector challenges.
Read full news article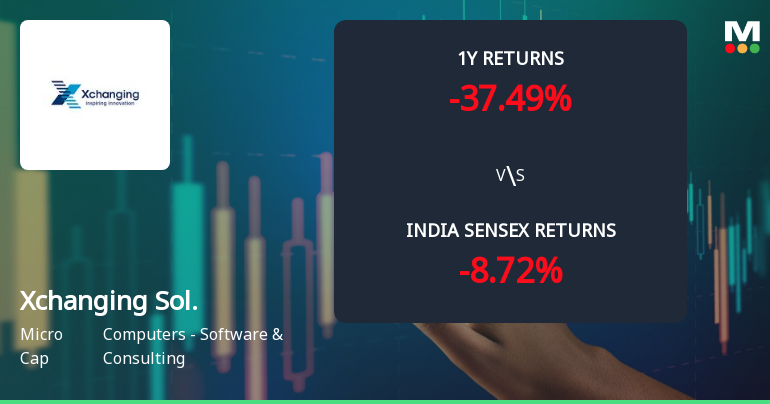
Xchanging Solutions Ltd Faces Bearish Momentum Amid Technical Downgrade
Xchanging Solutions Ltd, a micro-cap player in the Computers - Software & Consulting sector, has experienced a notable shift in its technical momentum, with key indicators signalling a deteriorating outlook. The company’s Mojo Grade was downgraded from Hold to Sell on 6 Nov 2025, reflecting growing bearish sentiment amid weakening price action and negative returns relative to the broader market.
Read full news article Announcements
Xchanging Solutions Limited - Other General Purpose
05-Dec-2019 | Source : NSEXchanging Solutions Limited has informed the Exchange regarding Disclosure of Related Party Transactions pursuant to Regulation 23(9) of SEBI ( LODR) Regulations, 2015.
Xchanging Solutions Limited - Appointment
14-Nov-2019 | Source : NSEXchanging Solutions Limited has informed the Exchange regarding Appointment of Ms Aruna Mohandoss as Company Secretary & Compliance Officer of the company w.e.f. November 13, 2019.
Xchanging Solutions Limited - Outcome of Board Meeting
13-Nov-2019 | Source : NSEXchanging Solutions Limited has informed the Exchange regarding Board meeting held on November 13, 2019.
Corporate Actions

No Upcoming Board Meetings

Xchanging Solutions Ltd has declared 20% dividend, ex-date: 11 Jul 25

No Splits history available

No Bonus history available

No Rights history available
Quality key factors
Valuation key factors
Technicals key factors
 Technical Indicator Scale: Bearish, Mildly Bearish, Sideways, Mildly Bullish, Bullish Turned
 Shareholding Snapshot : Mar 2026
Shareholding Compare (%holding)
Promoters
None
Held by 1 Schemes (0.0%)
Held by 7 FIIs (0.11%)
Xchanging (mauritius) Limited (52.07%)
None
22.43%
Quarterly Results Snapshot (Consolidated) - Mar'26 - QoQ

QoQ Growth in quarter ended Mar 2026 is 5.08% vs -7.56% in Dec 2025
QoQ Growth in quarter ended Mar 2026 is 23.22% vs -18.94% in Dec 2025
Half Yearly Results Snapshot (Consolidated) - Sep'25
Growth in half year ended Sep 2025 is 16.13% vs 1.19% in Sep 2024

Growth in half year ended Sep 2025 is 46.85% vs 320.78% in Sep 2024
Nine Monthly Results Snapshot (Consolidated) - Dec'25
YoY Growth in nine months ended Dec 2025 is 13.01% vs 3.23% in Dec 2024
YoY Growth in nine months ended Dec 2025 is 23.70% vs 2,546.21% in Dec 2024
Annual Results Snapshot (Consolidated) - Mar'26
YoY Growth in year ended Mar 2026 is 9.75% vs 6.01% in Mar 2025
YoY Growth in year ended Mar 2026 is 19.91% vs 261.90% in Mar 2025
About Xchanging Solutions Ltd

Company Coordinates


