
Compare Zenith Steel with Similar Stocks
Dashboard
With a Negative Book Value, the company has a Weak Long Term Fundamental Strength
- Poor long term growth as Net Sales has grown by an annual rate of -7.19% and Operating profit at 0% over the last 5 years
- The company has a negative book value of Rs 248.93 crore
Negative results in Mar 26
Risky - Negative EBITDA
Underperformed the market in the last 1 year
Stock DNA
Iron & Steel Products
INR 87 Cr (Micro Cap)
25.00
26
0.00%
-0.88
-1.33%
-0.34
Total Returns (Price + Dividend) 
Latest dividend: 0.5000007968127489 per share ex-dividend date: Jul-07-2010
Risk Adjusted Returns v/s
Returns Beta

News

Zenith Steel Pipes & Industries Ltd is Rated Strong Sell
Zenith Steel Pipes & Industries Ltd is rated Strong Sell by MarketsMOJO. This rating was last updated on 28 July 2025, reflecting a significant reassessment of the stock’s outlook. However, the analysis presented here is based on the company’s current fundamentals, returns, and financial metrics as of 17 June 2026, providing investors with an up-to-date perspective on the stock’s position.
Read full news article
Zenith Steel Pipes & Industries Ltd is Rated Strong Sell
Zenith Steel Pipes & Industries Ltd is rated Strong Sell by MarketsMOJO. This rating was last updated on 28 July 2025. However, the analysis and financial metrics discussed here reflect the company’s current position as of 08 June 2026, providing investors with the latest insights into its performance and outlook.
Read full news article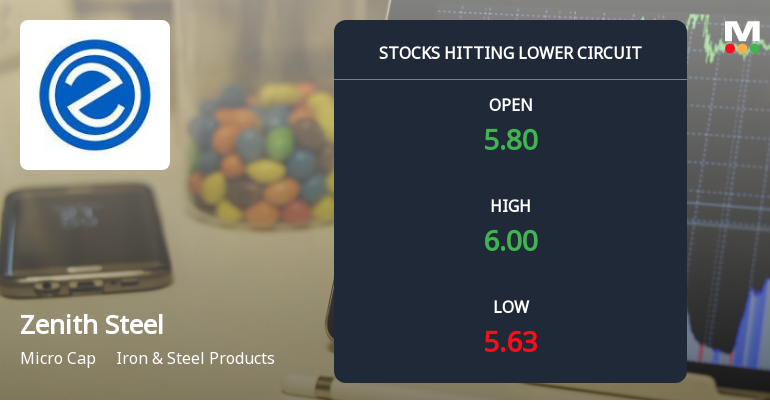
Below All Moving Averages and Now at Lower Circuit: Zenith Steel Pipes & Industries Ltd Loses 4.07% in a Single Session
At Rs 5.61, sellers were still queuing — but no buyers stepped forward. Zenith Steel Pipes & Industries Ltd locked at its lower circuit of 5% on 3 Jun 2026, reflecting unfilled supply and a frozen price amid persistent selling pressure.
Read full news article Announcements
Zenith Birla (India) Limited - Updates
18-Nov-2019 | Source : NSEZenith Birla (India) Limited has informed the Exchange regarding 'Newspaper publication copy of financial results for the quarter and half year ended sept2019'.
Zenith Birla (India) Limited - Outcome of Board Meeting
15-Nov-2019 | Source : NSEZenith Birla (India) Limited has informed the Exchange regarding Board meeting held on November 14, 2019.
Zenith Birla (India) Limited - Updates
08-Nov-2019 | Source : NSEZenith Birla (India) Limited has informed the Exchange regarding 'Notice of Board Meeting published in news paper'.
Corporate Actions

No Upcoming Board Meetings

Zenith Steel Pipes & Industries Ltd has declared 6% dividend, ex-date: 07 Jul 10

No Splits history available

Zenith Steel Pipes & Industries Ltd has announced 1:5 bonus issue, ex-date: 11 Aug 10

No Rights history available
Quality key factors
Valuation key factors
Technicals key factors
 Technical Indicator Scale: Bearish, Mildly Bearish, Sideways, Mildly Bullish, Bullish Turned
 Shareholding Snapshot : Mar 2026
Shareholding Compare (%holding)
Non Institution
0.2022
Held by 4 Schemes (0.0%)
Held by 0 FIIs
Birla Bombay Private Limited (5.74%)
Hitesh Ramji Javeri (5.48%)
71.84%
Quarterly Results Snapshot (Consolidated) - Mar'26 - YoY

YoY Growth in quarter ended Mar 2026 is -54.51% vs -42.36% in Mar 2025

YoY Growth in quarter ended Mar 2026 is -50.00% vs -71.89% in Mar 2025
Half Yearly Results Snapshot (Consolidated) - Sep'25
Growth in half year ended Sep 2025 is -43.74% vs 12.35% in Sep 2024
Growth in half year ended Sep 2025 is 170.76% vs 76.16% in Sep 2024
Nine Monthly Results Snapshot (Consolidated) - Dec'25
YoY Growth in nine months ended Dec 2025 is -55.07% vs -3.79% in Dec 2024
YoY Growth in nine months ended Dec 2025 is 222.66% vs 75.78% in Dec 2024
Annual Results Snapshot (Consolidated) - Mar'26
YoY Growth in year ended Mar 2026 is -55.18% vs -16.85% in Mar 2025
YoY Growth in year ended Mar 2026 is 1,804.35% vs 132.86% in Mar 2025
About Zenith Steel Pipes & Industries Ltd

Company Coordinates


